Bode analysis comprises graphical representations of magnitude and phase information, both plotted as a function of frequency (w). Bode plots clearly illustrate the relative stability of a system. Gain and phase margin requirements of a closed-loop system are often defined in terms of Bode plots.
Bode plots have a variety of applications, including:
•Analysis of system closed-loop performance characteristics
•Determination of resonant frequencies and maximum power amplitude
Bode plots can also be used for the specification and design of compensators.
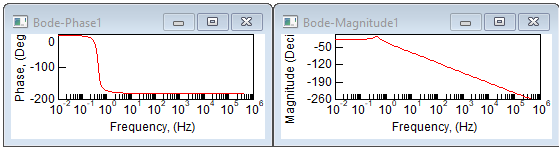
Analyze > Frequency Response lets you set the phase and gain margins before displaying the Bode phase and magnitude plots, like the ones shown below:
Both plots are relative to log frequency (rad/s units). The magnitude units are log and the phase units are degrees.
To generate Bode magnitude and phase plots
1. Prepare the system linearization.
2. Choose Analyze > Frequency Range to define the range and resolution of the natural
3. Choose Analyze > Frequency Response to set the phase and gain margins and create the Bode phase and magnitude plots.
4. Resize or zoom in on the plot for better viewing.