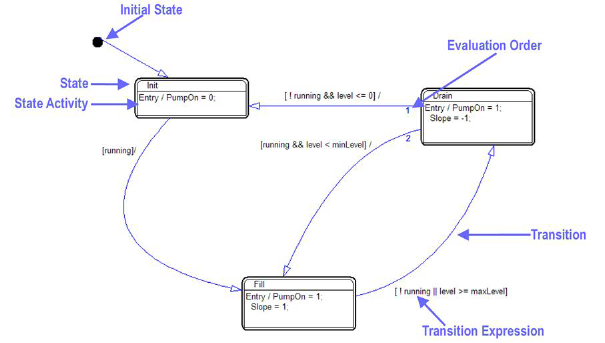
A state chart is a graphical representation of a finite-state machine — a system with a defined number of states, where transition from one state to another occurs when certain conditions are met. An example of a simple state chart is shown below:

The above state chart demonstrates a three-state pump with operating states defined as:
•Control ON
•Control ON to pump water into the tank
•Control ON to pump water out of the tank
During simulation, the pump controls the water level in the tank by keeping the water within specified minimum and maximum levels. Step-by-step directions to create this pump are in the Embed Common Tasks Tutorial at Altair Community Documentation.
You can create state charts anywhere within a block diagram, and you can easily exchange data between the state chart and the continuous portion of the diagram. In addition, if you have Embed Pro or Embed Personal, you can generate code to run on an embedded target .
The continuous portion of the block diagram can control state chart execution with triggers.