
You create a state chart by inserting a state chart block into a block diagram and then populating it with state chart elements, including states, pseudostates, transitions, and a subset of standard blocks.
A block diagram can contain multiple state charts.
To create a state chart
1. Choose State Charts > state chart.
2. Click in the work area.
3. CTRL+right-click the State Chart.

Appearance: Applies color to a state chart block to make it more visible in your block diagram.
Contained State Count: Indicates the number of states and pseudostates in the state chart.
Log executed C instructions: Logs the executed C instructions in the specified file. In the event that state chart execution does not match expectation, examining the log lets you detect and correct the unexpected behavior.
Protection: Restricts access to the state chart. You can choose locked with password, read-only password protection, and read-only requested protection. A password can contain up to 10 alphanumeric characters. Passwords are case sensitive.
Orthogonal chart drawing pattern: Draws transitions as straight lines.
Run chart to completion: Default state chart execution is synchronized with the specified time step in the Embed diagram. This means that the state chart is active at the beginning of each simulation step. For active states, outgoing transitions are evaluated and fired with respect to transition triggers and conditions. After this, the state chart produces an inactive condition until the next simulation step.
When Run chart to completion is activated, transition evaluation and exiting and entering states — as described above — continues until the state chart reaches a stable state and none of the outgoing transitions can be fired. Thus, multiple transitions are fired during a single simulation step.
The following sequence of events is plotted with and without Run chart to completion:
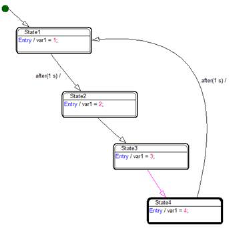
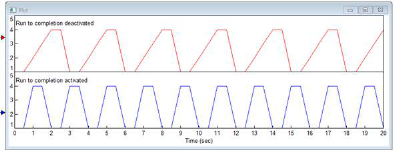
With Run chart to completion de-activated, the outgoing transitions are fired for each state (upper plot). With Run chart to completion activated, only the transitions for the first and last state are fired (lower plot).
State Chart Name: Specifies an alphanumeric state chart name. By default, state chart blocks are named State ChartN, where N is a unique number. For long names, press CTRL+ENTER to continue the name on a new line.
Transition with higher priority is: Defines the evaluation transition order when a composite state and one of states enclosed by the composite state have transitions targeted to a state outside of the composite state. Both transitions must have a trigger. This option for a newly created state chart is set up in the Priorities window. It can be changed for a particular state chart in state chart block dialog. You can make this a default setting in the State Charts > Preferences dialog.
Transition from initial Pseudostate is executed: If Before simulation first step is activated, then at simulation start but before the first simulation step, the state chart leaves the initial pseudostate and moves to the default state. The initial transition cannot have triggers or guards, but it can have behavior and it is executed. For the targeted state, the entry behavior is executed if presented.
The simulation then starts and, after the first step, the state chart moves to the next state because there is a transition without triggers or guards. The exit behavior for the transition's source state is then executed.
If On simulation first step is selected, the state chart moves from the initial pseudostate to the default state on the first simulation step.
You can make this a default setting in the State Charts > Preferences dialog.