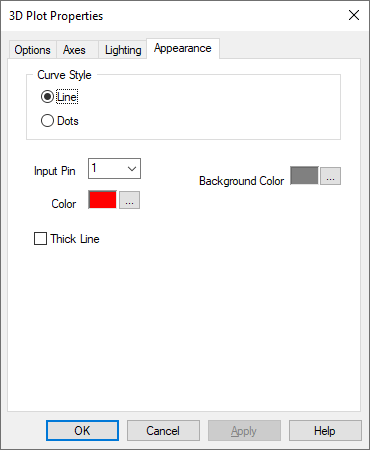
If you select a curve plot, you use the Appearance property sheet to control the curve style and line thickness, input connector color, and background color of the plot.
Background Color: Specifies the background color of the plotting window. To choose a new color, click … and make the appropriate selections in the Color dialog. Click OK when you are satisfied with your selection.
Color: Applies a color to the specified input connector and corresponding curve. To choose a new color, click … and make the appropriate selections in the Color dialog. Click OK when you are satisfied with your selection.
Dots: Plots the individual data points, as shown in the Lorenz Attractor plot below:

Line: Plots a 3D curve or line, as shown in the Lorenz Attractor
plot below:
Input Pin: Lets you specify up to eight input connectors. Each connector represents an individual curve. To add or remove or remove connectors, use Add Connector and Remove Connector.
Thick Line: Turns on antialiasing mode, which results in thicker, smoother, and uninterrupted lines.