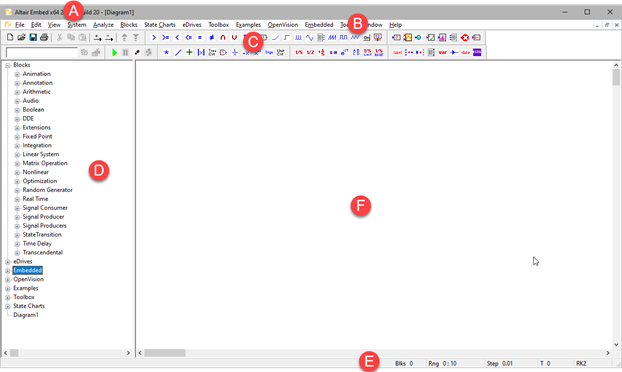
Embed provides a visual environment for building models of dynamic systems and defining algorithms using block diagrams.

A The title bar includes the name of the currently open diagram. As you develop diagrams with hierarchy and drill into the hierarchy, you can look at the title bar to see where you are in the diagram.
B The menu bar contains drop down menus for all commands and blocks. You can customize the menu bar with your own menu items, commands, and blocks with Edit > Preferences > Menu Directories.
Commands and blocks can also be
accessed from the Blocks and Diagram Browser windowpane, toolbar, pop-up menus,
and short-cut keyboard commands. For example, to open a new diagram, you select
File > New from the menu, click the  toolbar button, or press CTRL+N.
C Toolbar buttons are shortcuts for commonly used editing, simulation, and debugging functions, along with commonly used blocks. You control the display of toolbar buttons with View > Toolbar. The User toolbar contains toolbar buttons you create with Tools > Customize > User Tool Bar.
Sometimes, when a toolbar button is dimmed, it is because the last mouse position was in the Blocks and Diagram Browser. Click the mouse anywhere in the work area to activate all available toolbar buttons.
To move a toolbar button group, drag the group to where you want it to appear in the toolbar.
D The Blocks and Diagram Browser provides a convenient way to insert blocks into a diagram and navigate within a multilayer diagram.
The upper part of the windowpane lists standard blocks, OpenVision blocks, Toolboxes, eDrives blocks, Digital Power blocks, and State Chart blocks. The windowpane includes the Embedded blocks, Comm blocks, and Digital Power blocks, if you have these add-ons.
The lower part of the windowpane displays the hierarchical structure of the currently open block diagram. The + and – signs that precede each level let you expand and contract the level. Click on a level to display it in the work area.
E The status bar keeps track of the number of blocks in your diagram, along with key simulation information including the simulation range, step size, elapsed simulation time, and currently selected integration algorithm. If the simulation is running, the current simulation time is also displayed. When you drag the mouse over a menu, menu command, or toolbar button, Embed displays a brief description of the item in the status bar.
Use View > Status Bar to show or hide the status bar.
F The work area is where you
build your block diagrams. As your diagrams become larger and more complex,
finding easy ways to move around them is essential. The scroll bars that run
along the bottom and right side of the work area let you pan to sections of your
diagram that are not currently visible on the screen. To hide or show the scroll
bars, use Edit >
Preferences. You can
also roll the mouse wheel or use the
 toolbar buttons to shrink and enlarge
the diagram.