Viewing Results on a 2D Plot
View the 2D far field plot of the antenna.
-
On the Results tab, in the
Results group, click the
 2D Plot icon.
-
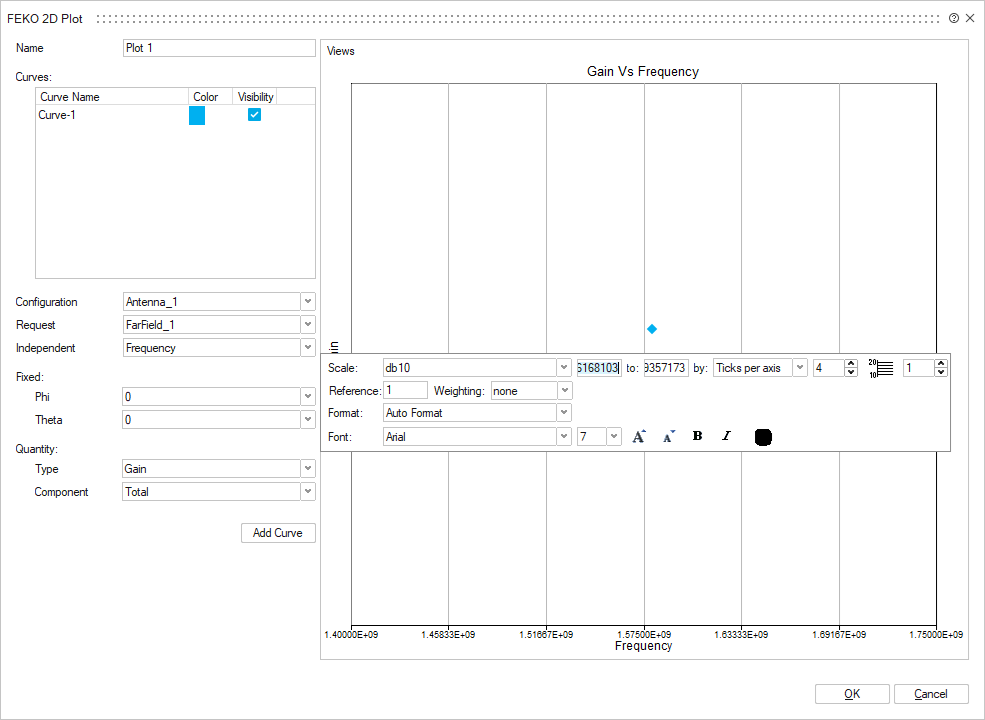
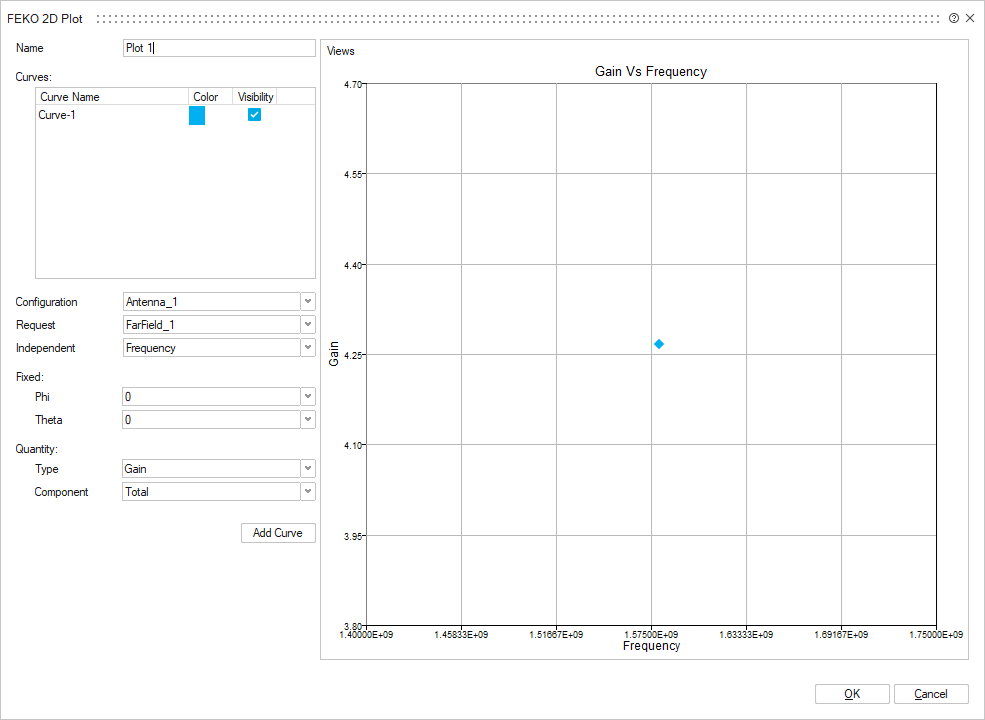
On the Feko 2D Plot dialog:
- In the Configuration drop-down list, select Antenna_1.
- In the Request drop-down list, select FarField_1.
- In the Independent drop-down list, select Frequency.
- In the Phi drop-down list, select 0°.
- In the Theta drop-down list, select 0°.
- In the Type drop-down list, select Gain.
- In the Component drop-down list, select Total.
-
To view the y-axis in dB, right-click on the y-axis and, from the right-click
context menu, in the Scale drop-down list, select
db10.