
ylabel
Annotates the y-axis.
Syntax
handle = ylabel(str)
handle = ylabel(hAxes, str)
h = ylabel(..., property, value, ...)
Inputs
- str
- Name of the y-axis.
- hAxes
- Axis handle. .
- property
- Properties that control the appearance or behavior of the graphics object.
- value
- Value of the properties.
Outputs
- h
- Handle of the label graphics object.
Examples
Simple ylabel
example:Figure 1. Simple ylabel example
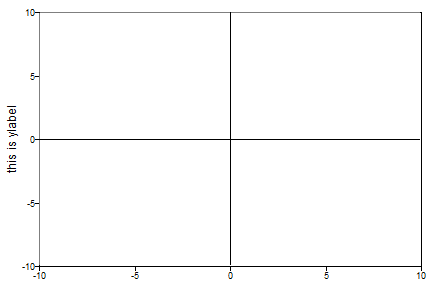
clf;
handle = ylabel('this is ylabel')Optional arguments
example:Figure 2. Optional arguments in ylabel command
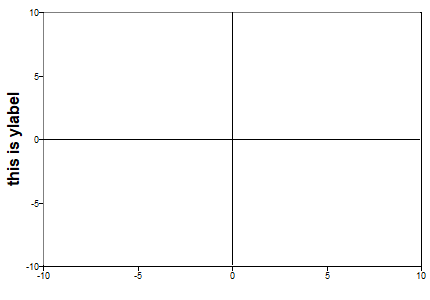
clf;
handle = ylabel('this is ylabel', 'fontsize', 12, 'fontweight', 'bold')