pastestyle
Sets the style properties to a plot object.
Syntax
pastestyle(handle)
pastestyle(handle, style)
Inputs
- handle
- Handle of an axes, line, surface, hggroup or text object.
- style
- A structure exported by the copystyle command.
Examples
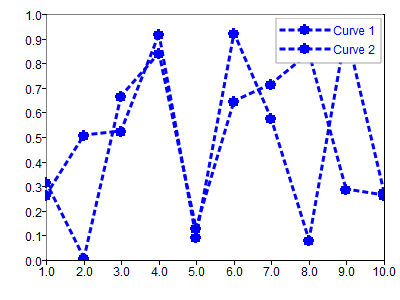
Paste the style to a line object:
clf;
lh = plot(rand(10,2));
legend;
% you may change the style of the first line using the set command or the graphical interface
set(lh(1),{'marker','linestyle','linewidth'},{'o',':',3});
% copy the style of the first line
copystyle(lh(1));
% paste the style to the second line
pastestyle(lh(2))
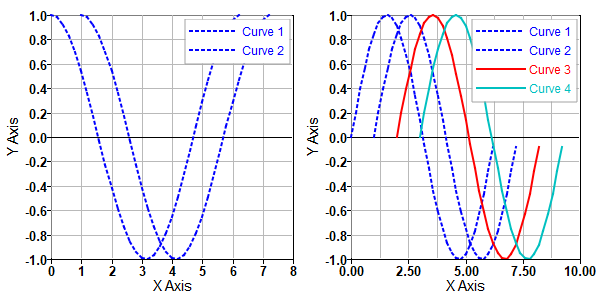
Paste the style to an axes object:
clf;
subplot(1,2,1)
x = [0:0.2:2*pi];
y1 = cos(x);
lh = plot([x;x+1]',[y1;y1]','b:');
set(gca,{'fontweight', 'fontsize','xgrid','ygrid'},{'bold',8,'on','on'});
xl = xlabel('X Axis');
yl = ylabel('Y Axis');
legend;
% get the handle of the first axes
ax1 = gca;

subplot(1,2,2);
y2 = sin(x);
plot([x;x+1;x+2;x+3]',[y2;y2;y2;y2]');
% paste the style of the first axes to the second axes -
% Note that the style of the 3rd and 4th line doesn't change because the first axes has only 2 lines
ax2 = gca;
pastestyle(ax2, copystyle(ax1));

Comments
The object that the style is pasted to must be the same type as the object that the style was copied from.
If the style argument is omitted then the style saved in memory will be applied to the object.
The pastestyle command will not create new objects, it will apply the style properties to existing objects. For example, if the style is copied from an axes object which has 3 lines and is pasted to an axes object which has 2 lines then the style of the 3rd line will be ignored.