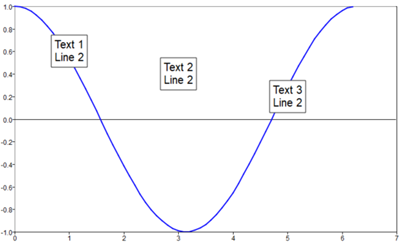
Creates a textbox at coordinate x,y with text
't'.
Syntax
h = text(x, y, t)
h = text(x, y, z, t)
h = text(..., property, value, ...)
Inputs
x, y, z
x, y, and z coordinates for the textbox. z is valid only in 3D plots.
Type: double | integer
Dimension: scalar
t
Text to be added in the axes.
Type: string | cell
Dimension: scalar
property
Properties that control the appearance or behavior of the graphics object.
Type: string
Dimension: scalar
value
Value of the properties.
Type: double | integer | string
Dimension: scalar
Outputs
h
Handle of the text graphics object.
Examples
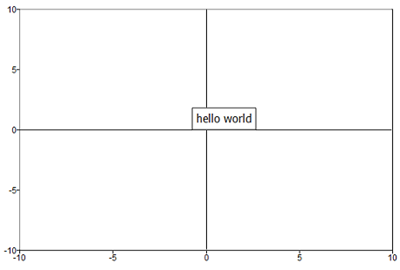
Simple textbox example:
clf
text(1,1,'hello world')
Figure 1. Simple text example
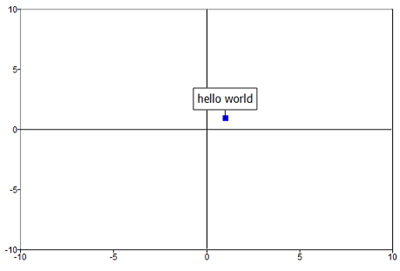
text example with alignment
properties:
clf;
scatter(1, 1);
t = text(1,1,'hello world', 'horizontalalignment','center', 'verticalalignment', 'top');
Figure 2. Text with horizontal and vertical alignment properties set
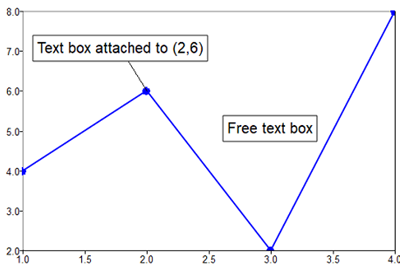
In 2D plots the property 'attached' may be used to control whether the text box will be connected to its origin point. By default 'attached' is 'on'. Example:
clf;
plot([4 6 2 8], '-o');
% Both boxes can be moved by mouse click and drag
% The attached text box is connected to the point by a line
t = text(2, 6,'Text box attached to (2,6)');
t = text(3, 5,'Free text box','attached','off');
Figure 3. Attached property example
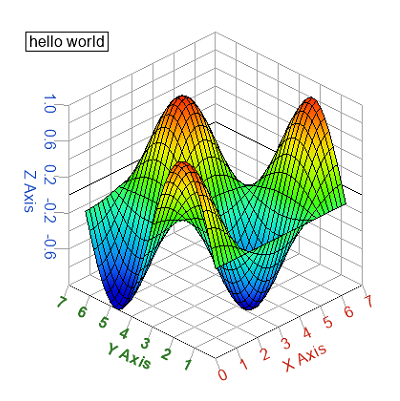
text example in a 3D plot:
clf;
x=[0:0.2:2*pi];
y=x;
z=sin(x')*cos(y);
s=surf(x, y, z);
t = text(10,90,'hello world');
Figure 4. Text in 3D plot
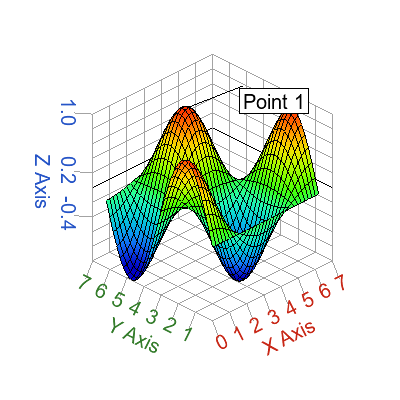
text pointing on a 3D point example:
clf;
x=[0:0.2:2*pi];
y=x;
z=sin(x')*cos(y);
s=surf(x, y, z);
t = text(3.2,4.6,1,'Point 1');
Figure 5. Text on 3D point
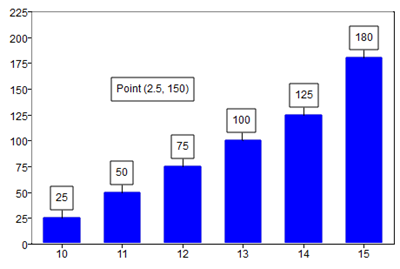
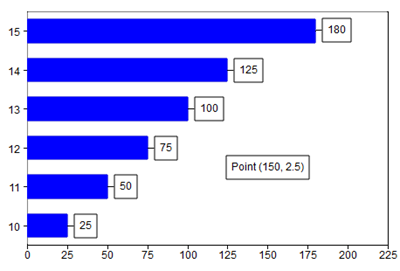
In 2D plots the category index is used to set the x position of a text box for vertical bars or the y position for horizontal bars:
In 3D plots, if the z value is not provided, then the x and
y coordinates are window coordinates (a percentage of the window width
and height). The reference point is the bottom left corner of the window.