Properties that control the appearance or behavior of the graphics object.
Type: string
Dimension: scalar
value
Value of the properties.
Type: double | integer | string
Dimension: scalar | vector
hAxes
Axis handle.
Type: double
Dimension: scalar
Outputs
h
Handle of the line graphics object.
Examples
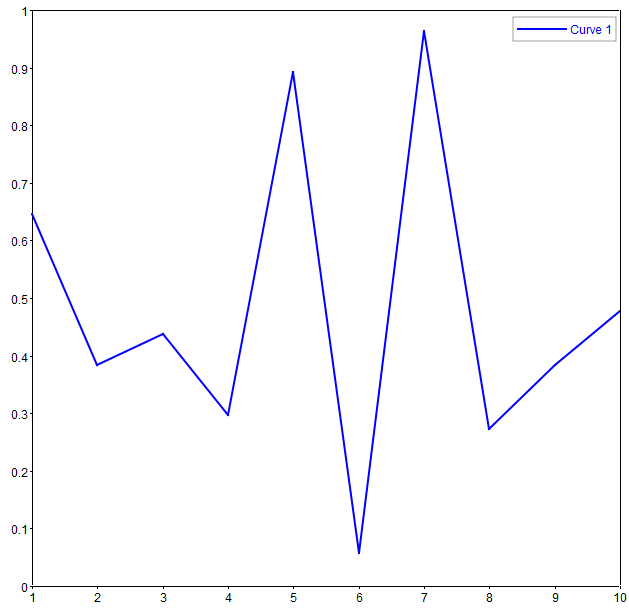
Simple plot example:
clf;
plot(rand(1, 10));
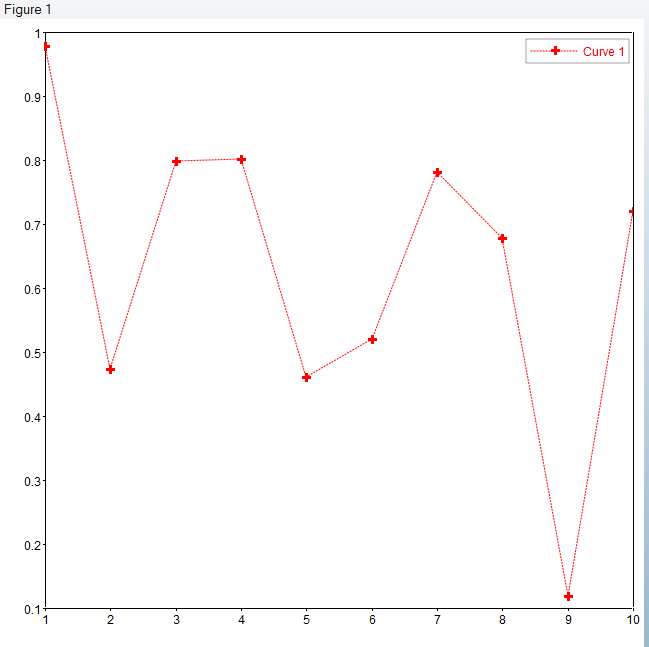
Simple plot example with
format:
clf;
plot(rand(1, 10), 'r:+', 'linewidth', 1);
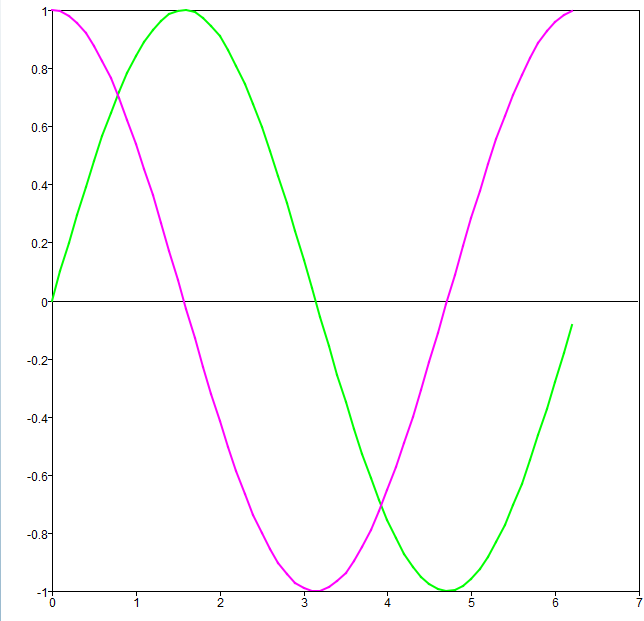
Simple plot example with format and multiple
lines:
clf;
x = [0:0.1:2*pi];
plot(x, sin(x), 'g', x, cos(x), 'm');
Comments
If x is omitted, the index of y is used as data to
associate with x axis. plot takes the optional arguments
fmt to control the line style. It can be either a format string or
property/value pair, or both. The form is:
h = plot([x,] y [, fmt] [, property, value] ...
plot
takes more arguments to create multiple lines in one axis:
h = plot(x, y, x, y, ...
h = plot([x,] y [, fmt] [, property, value], [x,] y [, fmt] [, property, value] ...
If
the first argument of plot() is an axis handle, lines are created in that
axis: