bar3
Creates 3d bars on an axis and returns the handles of the bars.
Syntax
h = bar3(z)
h = bar3(z, color)
h = bar3(z, 'rowhandle')
h = bar3(z, color, 'rowhandle')
h = bar3(hAxes, ...)
Inputs
- z
- Range of the x, y, and z axes..
- color
- Color of the bar plot.
- 'rowhandle'
- If the keyword 'rowhandle' is given then the bar3 command will return a handle for each row of the bar plot.
- hAxes
- Axis handle. .
Outputs
- h
- Handle of the surface graphics object.
Examples
Simple bar3 example:
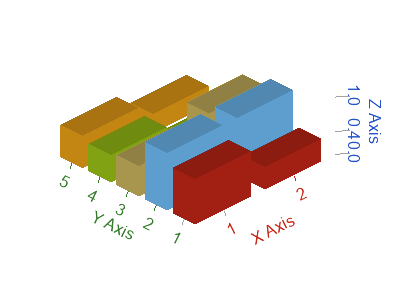
bar3(rand(5,3));Use the 'rowhandle' keyword to obtain a handle for each bar row:
clf;
h = bar3(rand(5,2),'rowhandle')
set(h(2), 'color',[115 194 255]);
set(h(2), 'zdata',[1 1]);
Comments
If there is no axis, one will be created. If the first argument of bar3 is an axis handle, bars will be created on that axis.