
quiver
Creates a 2D quiver plot in an axis.
Syntax
h = quiver(u, v)
h = quiver(x, y, u, v)
h = quiver(x, y, u, v, sf)
h = quiver(x, y, u, v, fmt)
h = quiver(hAxes, ...)
Inputs
- u, v
- Coordinates of vectors.
- x, y
- Coordinates of vector origin.
- sf
- Scaling factor that controls the length of the vectors. The default value is 0.9. If set to 0 the vectors are not scaled.
- fmt
- Formatting string for the vector. It can be any combination of the following
strings:
- line style: '-', '-.', ':', '--', '-:'.
- line color: 'r', 'g', 'b', 'c', 'y', 'm', 'w', 'k'.
- marker style: 's', 'o', 'd', 'x', 'v', '^', '+', '*', '.'.
- hAxes
- Axis handle.
Outputs
- h
- Handle of the quiver graphics object.
Examples
Simple quiver plot example:
Figure 1. Simple quiver plot
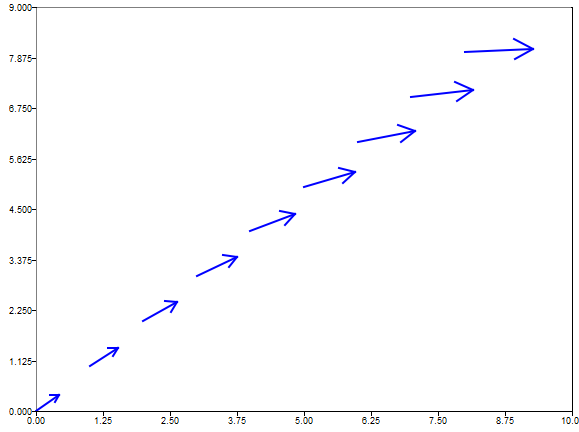
clf;
u = linspace(1,3,9);
v = sin(linspace(1, 3, 9));
qh = quiver(0:8, 0:8, u,v);
axis([0 10 0 9]);
quiver plot style:
Figure 2. quiver plot style
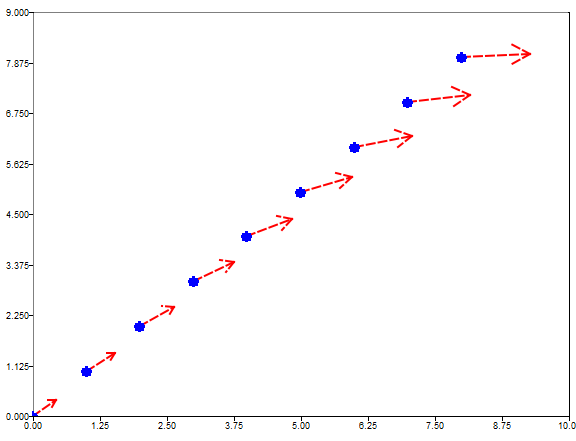
clf;
u = linspace(1,3,9);
v = sin(linspace(1, 3, 9));
qh = quiver(0:8, 0:8, u,v);
axis([0 10 0 9]);
set(qh, 'color', 'r')
set(qh, 'linestyle', '--')
set(qh, 'marker', 'o')
quiver plot with autoscaling disabled:
Figure 3. Vector autoscale 'off'
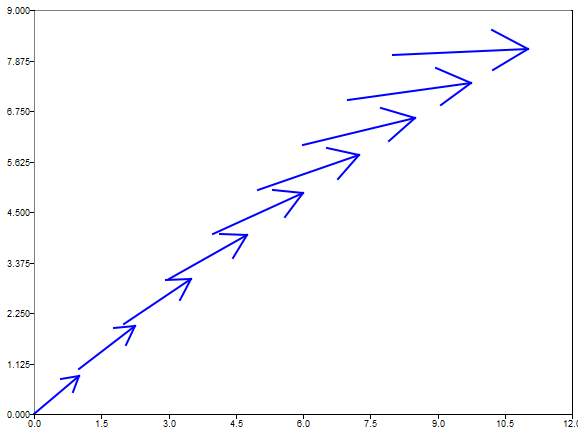
clf;
u = linspace(1,3,9);
v = sin(linspace(1, 3, 9));
qh = quiver(0:8, 0:8, u,v);
axis([0 12 0 9]);
set(qh,'autoscale','off');
Scale arrow head:
Figure 4. Arrow head size set to 0.9
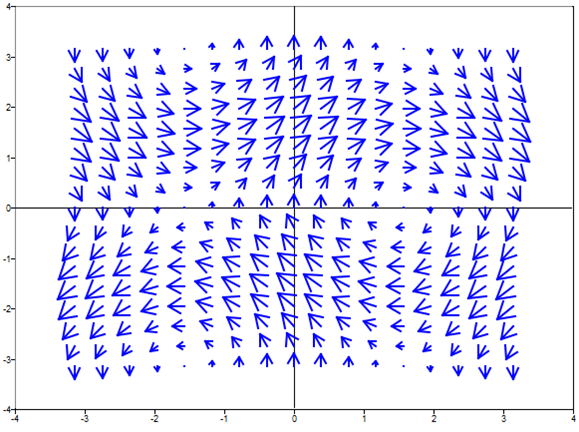
clf;
[x, y] = meshgrid(-pi:pi/8:pi, -pi:pi/8:pi);
u = sin(y);
v = cos(x);
qh = quiver(x,y,u,v);
set(qh,'maxheadsize',0.9)
Comments
If there are no axes, they are created first.