
bar
Creates bars in an axis and returns handles of the bars.
Syntax
h = bar(x, y)
h = bar(x-categories, y)
h = bar(..., width)
h = bar(..., style)
h = bar(..., property, value, ...)
h = bar(hAxes, ...)
Inputs
- x,y
- Range of the x and y axes.
- x-categories
- Names of the categories.
- width
- The bar width.
- style
- Style of each groups of bars. Either "grouped" (default style) or "stacked."
- property
- Properties that control the appearance or behavior of the graphics object.
- value
- Value of properties.
- hAxes
- Axis handle.
Outputs
- h
- Handle of the bar graphics object.
Examples
Simple bar
example:Figure 1. Bar plot
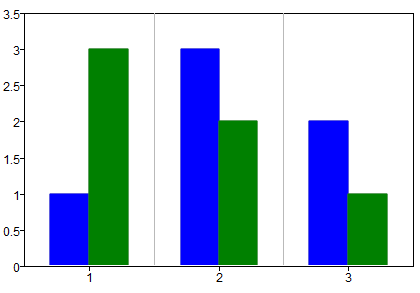
clf;
a=bar([1 2 3], [1 3 2; 3 2 1]);Simple bar with multi-format
tags:Figure 2. Bar plot with options
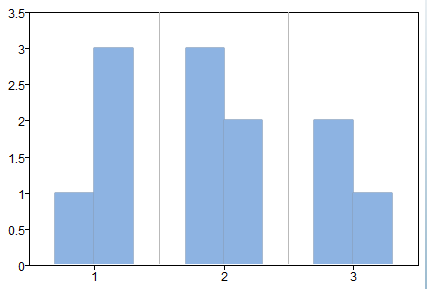
clf;
a=bar([1 2 3], [1 3 2; 3 2 1], 'facecolor', [141 179 226]);
get(a)bar with category values on the x axis:Figure 3. Bar plot with category values on the x axis
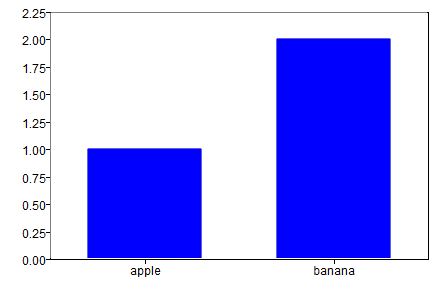
clf;
bar({'apple', 'banana'}, [1 2]);Show the bar values over each bar:Figure 4. Show the bar values
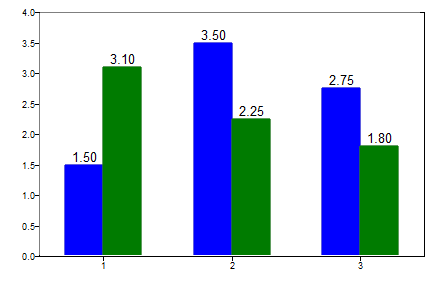
clf;
a=bar([1 2 3], [1.5 3.50 2.75; 3.1 2.25 1.8]);
set(gca,'barlabels','on');
set(gca,'barlabelsfontsize',10);
set(gca,'barlabelsnumericformat','fixed');
set(gca,'barlabelsnumericprecision', 2);
Comments
If there is no axis, one will be created . If x is omitted, the index of y is used as data to associate with the x axis. If the first argument of bar() is an axis handle, the bars will be created in that axis.