Creates a bubble chart and returns the handle of the scatter graphics object.
Syntax
h = bubblechart(x, y, size)
h = bubblechart(x, y, size, cdata)
h = bubblechart(..., property, value, ...)
h = bubblechart(hAxes, ...)
Inputs
x,y
Range of the x and y axes.
Type: double | integer
Dimension: scalar | vector | matrix
size
The marker size of each point.
Type: integer
Dimension: scalar | vector
cdata
An Mx3 matrix that defines the color of each scattered dot.
Type: double | integer
Dimension: matrix
property
Properties that control the appearance or behavior of the graphics object.
Type: string
Dimension: scalar
value
Value of the properties.
Type: double | integer | string
Dimension: scalar | vector
hAxes
Axis handle. .
Type: double
Dimension: scalar
Outputs
h
Handle of the scatter graphics object.
Examples
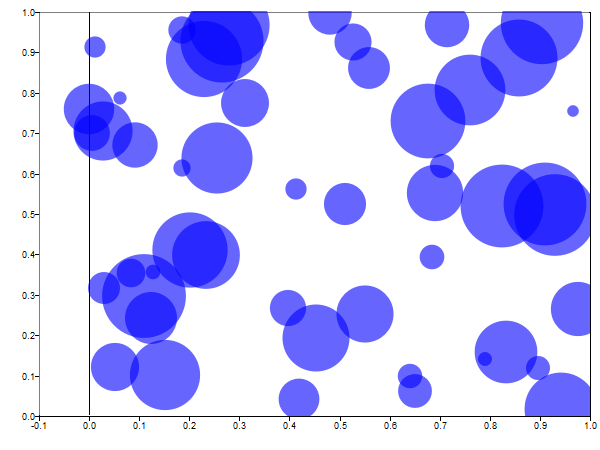
Simple bubblechart example:
clf;
x = rand(50,1);
y = rand(50,1);
s = 50*rand(50,1);
b = bubblechart(x, y, s);
Figure 1. Bubble chart
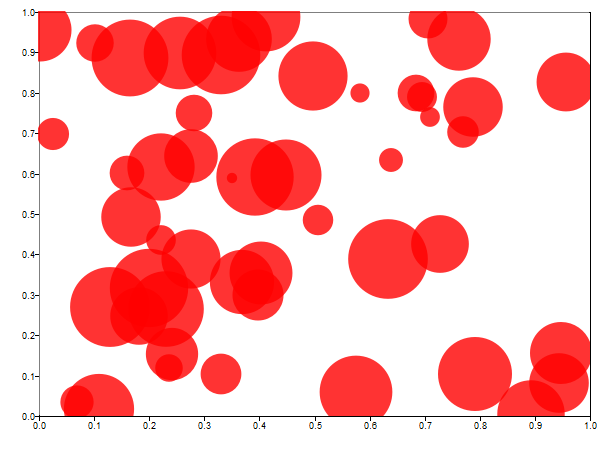
Set marker color and opacity:
clf;
x = rand(50,1);
y = rand(50,1);
s = 50*rand(50,1);
b = bubblechart(x, y, s, 'markerfacecolor', 'r', 'markerfacealpha', 0.8);
Figure 2. Bubble chart with custom color and opacity
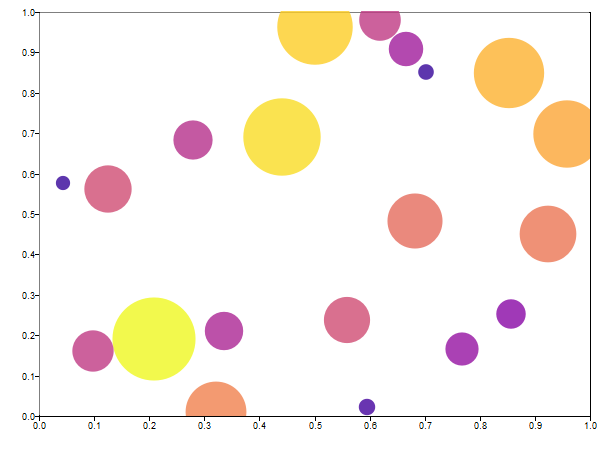
Use a colormap to set the color of each point:
clf;
x = rand(20,1);
y = rand(20,1);
s = 50*rand(20,1);
cmap = plasma(30);
cdata = cmap(ceil(s*30/max(s)), :);
bubblechart(x, y, s, cdata, 'markerfacealpha', 0.8);
Figure 3. Use a colormap with bubble chart
Comments
If there is no axis, one will be created first.
bubblechart is a wrapper on the scatter command. By default, the marker style ('marker') is set to circle ('o') and the marker opacity ('markerfacealpha') is set to 0.6.