Input sample. data can be a matrix where each column is a dataset, or, a cell of matrices.
Type: cell | mat
group
If data is a vector, group may be used to group data. group must be a vector with the same length as data.
Type: vector
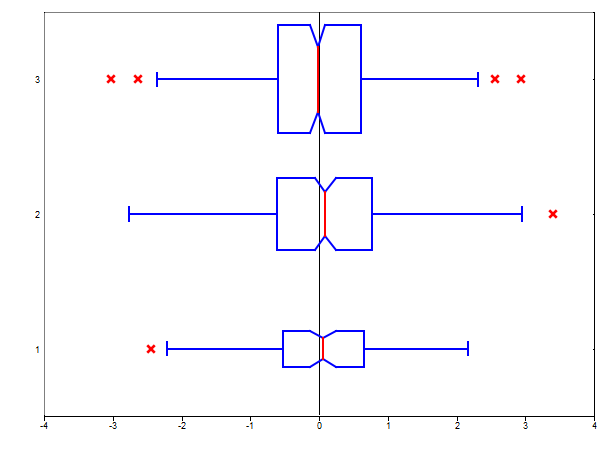
notch
Controls the notch of the box. The notch displays the confidence interval around the median. Typical values are in range [0, 1]. The default value is 0.
Type: scalar
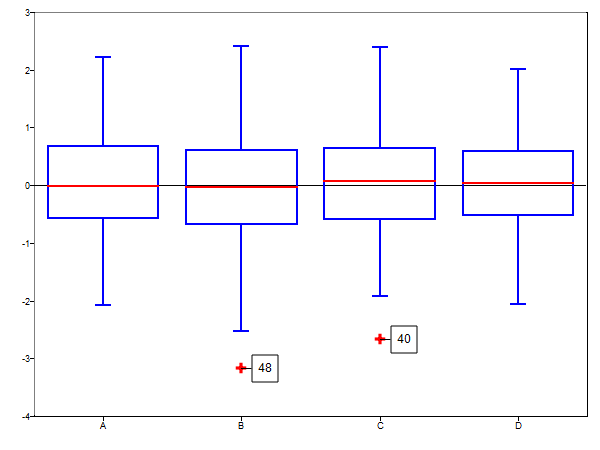
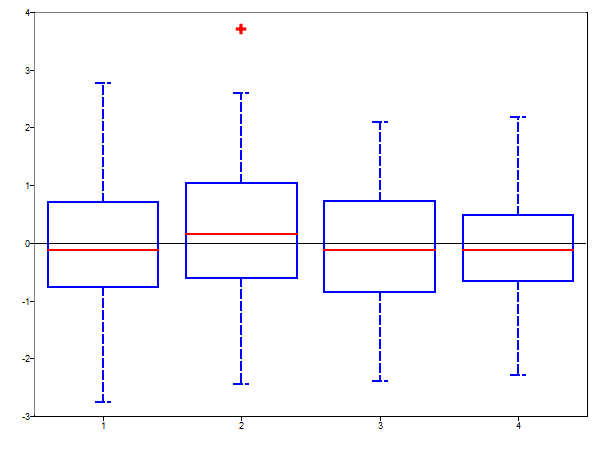
symbol
The display symbol for the outlier values. The default values are '+' for outliers between whisker*IQR and 2*whisker*IQR and 'o' for outliers > 2*whisker*IQR.
Type: string
orientation
Sets the orientation of the box plot. Valid values are 0 for horizontal and 1 for vertical. Default value is 1.
Type: integer
whisker
Controls the length of the whiskers as a multiplier of IQR. Default value is 1.5.
Type: scalar
options
The following options may be used to change the appearance of the box plot:
'boxstyle'
Specifies the style of the box. Valid values are 'outline' (default) and 'filled'.
Type: string
'boxwidth'
Specifies the box width. Valid values are 'proportional' (default) and 'fixed'..
If 'proportional', the width of each box is proportional to the number of elements in the dataset.
If 'fixed', all boxes have the same width.
Type: string
'capwidths'
Specifies the width of the whisker cap. The width is calculated as 'capwidths'*'widths'/4. Default value is 1.
Type: scalar
'colors'
Specifies the color of each box. Can be a Nx3 matrix or a string.
Type: matrix | string
'labels'
Specifies the name of each group of elements. Must be a cell of strings.
Type: cell
'notch'
Specifies the notch of the box. Valid values are 'on' (notch value is 0.25), 'off' (default) or a scalar value.
Type: scalar | string
'orientation'
Specifies the orientation of the boxes. Valid values are 'horizontal' (or 0) and 'vertical' (or 1, default).
Type: string
'outliertags'
Display or not the outlier index next to the outlier symbol. Valid values are 'on' and 'off' (default).
Type: string
'positions'
Specifies the position of each dataset on the X axis. Must be a vector with length equal to the number of datasets.
Type: vector
'sample_ids'
Specifies a string id for each element. Must be a cell of cells. Each nested cell must be a cell of strings containing the ids of elements in a dataset.
Type: cell
'symbol'
Specifies the outliers symbol. If one symbol is given, for example '^', then the outliers between whisker*IQR and 2*whisker*IQR will be displayed using this symbol. If two symbols are given, for example ['^', 'v'], then the second symbol will be used to display outliers > 2*whisker*IQR.
Type: matrix | string
'whisker'
Specifies the length of the whiskers as a multiplier of IQR. Default value is 1.5.
Type: scalar
'widths'
Specifies a scaling factor for the box widths. Default value is 0.4.
Type: scalar
Outputs
s
A 7xN matrix containing statistics for each dataset. The matrix rows are:
Minimum
1st quartile
Median
3rd quartile
Maximum
Lower confidence limit for the median
Upper confidence limit for the median
h
A struct with the handles of the graphics object. The struct contains the following fields: