plotgraph
Overview
This utility is used to plot the 2D linear graph.
Syntax
simlab.plotgraph(xIvalue, xDvalue, yDvalueArr, x_axis_title, y_axis_title, curve_names, save_plot_path, Design_limit);Use Case
- It supports the following options to plot graph
-
A simple linear 2D graph
-
Multiple curve plot
-
Either capture plot image or plot on screen
-
- User can extract the values from the results file or Input the values directly and plot the graph.
Utility Input/output
simlab.plotgraph( xIvalue, xDvalue, yDvalueArr, x_axis_title, y_axis_title, curve_names, save_plot_path, Design_limit); -
xIvalue - list of x axis values (Integer values)
-
xDvalue - list of x axis values (Decimal values)
-
yDvalueArr - list of multiple data curve values
-
x_axis_title - x axis title
-
y_axis_title - y axis title
-
curve_names - list of multiple curve name (if any)
-
save_plot_path - path to save graph image
-
Design_limit - Flag to set the last curve as design limit
-
X axis value either xIValue or xDvalue should given.
-
If save_plot_path is given it will save the plot as Image, if NULL then it will plot the graph on the screen.
-
Design_Limit is true, last curve data will be plotted as a dotted line in the curve.
Sample
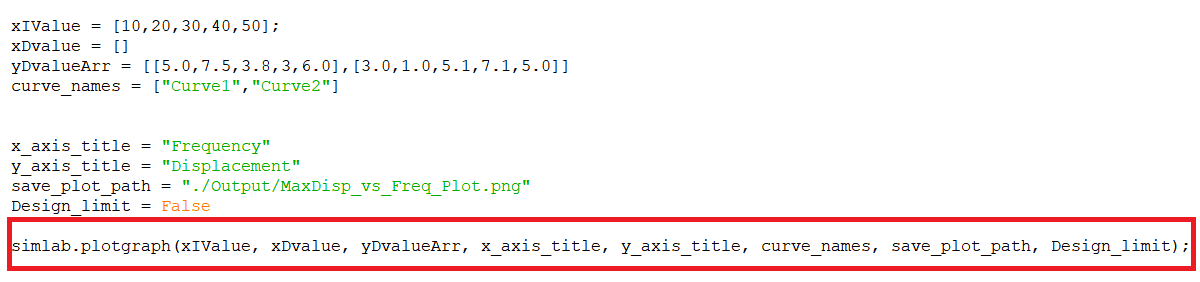
In the sample script example, it will get the maximum displacement value from each simulation in a load case and plot as a separate curve for each load case.