capturePlotImage
Overview
This utility is used to extract the bore plots as an image after bore distortion analysis and can also update the plot settings.
Syntax
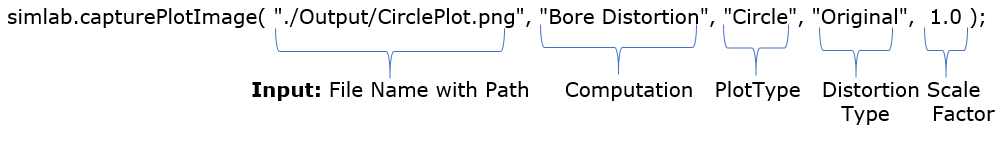
simlab.capturePlotImage(FilePath, Computation, PlotType, DistortionType, PlotScaleFactor);where,
- FilePath: Plot Image File name with path
- Computation: Bore Distortion
- PlotType: "Circle"/ "Diametral Distortions"
- DistortionType: "Original"/ "True(Expansion and Eccentricity removed)" / "True(Eccentricity removed)"
- PlotScaleFactor: To scale the graph value to mm or microns
User Case
- This utility can be used to capture the plot images after the bore distortion analysis. It will be useful to analyze the problem and it is used in report generation.
Utility Input/output
Note:
- If the User depth is mentioned in the Bore Distortion computation, plots are saved only for those depth values. Otherwise, it will capture for all depth values for Circle Plot
- All the order plots are captured for Diametral Distortion plot
- All selected depth values are captured as a single image in the given File Path. Then individual depth values are captured as a separate image with the name "OrgFileName_Depth_Value.png" for Circular plot type and "OrgFileName_Order_value.png" for Diametral Distortion plot type
Sample
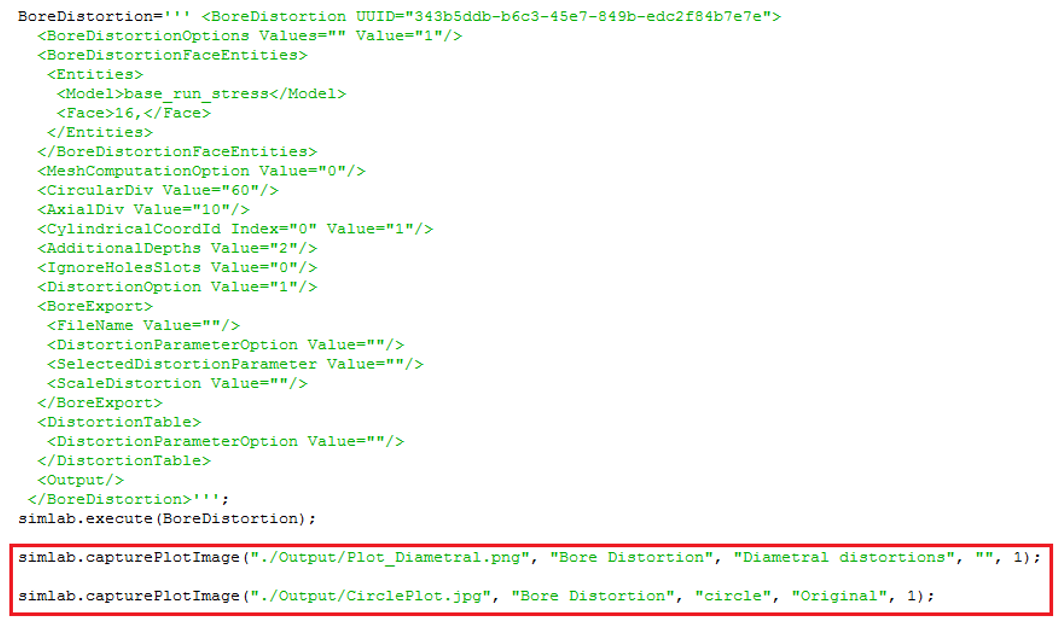
Note: Sample Script
Plot Settings
We can update the settings of each plot like Plot Title, Label Names, Numbers of
splits, minimum and maximum values along X and Y Direction by calling this Plot
Settings DomNode before the capturePlotImage call. Otherwise, it will plot with
default settings.
Note: If the User wants to update settings for Circle Plot, it is
enough to have CirclePlot contents alone in the PlotSettings.