Jupyter Reports for Full Vehicles and Suspension Analyses
Jupyter Notebook is an open-source web application that allows you to create and share documents containing live code, equations, visualizations, and narrative text. Jupyter Notebook offers fast, interactive new ways to prototype and explain your code, explore and visualize your data, and share your ideas with others. These documents are saved with the extension “ipynb”.
Jupyter reports in MotionView (for Vehicle Models) will take advantage of the interactivity and extensibility that the application offers and provide simulation reports that are created immediately after the solver execution, and are easily editable and sharable.
By using Jupyter reports in MotionView, you can now have one click generated simulation reports that can be easily modified and shared as a PDF or Jupyter Notebook (ipynb) files.
Accessing Jupyter Reports
Jupyter reports are accessible along with the Vehicle Tools extension. To create Jupyter reports, you need to run a simulation and have the result files generated. Only MotionSolve *.plt files are currently supported.
Before the simulation, MotionView creates a json format Jupyter report file (jp_rep) that contain the necessary model information that is needed for the report creation. Each result file (.plt) is associated with the corresponding Jupyter report file (jp_rep) by sharing the same file names. The report is created according to predefined templates provided along with the installation in ipynb format. It is possible to create user defined templates with desired plotting information for the new report.
The following sections will explain the ribbons and the dialogs useful in plotting Jupyter reports.
- Create Jupyter Report

- The main icon is used to create and launch the Jupyter report. Two possible cases
could occur:Case 1: You may want to plot the report for an active event in the model that is loaded in the session and solved using MotionSolve. When you click on the icon, a terminal window will open containing information about the Python Local server of Jupyter Environment and a web browser will open and load the simulation report. No additional input is needed. All the necessary information is auto resolved:
- Input results plt file (same name as the .xml).
- Template file from the Entity Editor of the active event.
- Saving the report file with the same name as plt.
Case 2: In a new session you click on the icon - a file browser will open asking you to select the input plt file(s). Once you select the .plt file(s), the report will load in a web browser. However, for a successful report plotting, the associated jp_rep file is also needed.
- Launch Jupyter Report

- This satellite ribbon (upper) is used to open an already created Jupyter report.
- Generate Jupyter Report

- Generate Jupyter Report satellite (lower) is used when you need to change the
default input parameters for the report creation. This includes the plt files
selection, the input template and the file name of the Jupyter report to be saved. By
clicking OK or Apply, a report with the
specified name will be created and launched.Note: You can plot multiple .plt files in the same report session as long as they follow the same report template.
Figure 2. 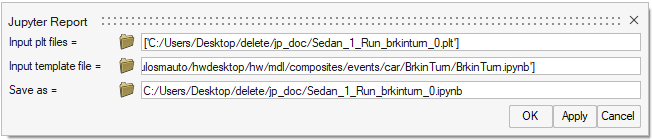
Working with Jupyter Reports
Jupyter reports offer plenty of useful functionality including modifying plots, adding new pages and printing reports to PDFs. The following paragraphs include brief introductions to these topics.
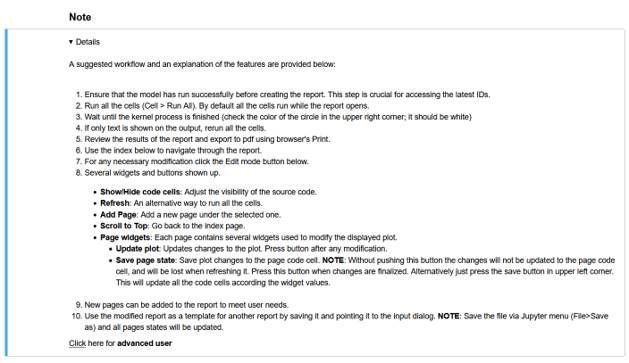
In the next section an Edit mode button is displayed followed by an Index containing a hyperlink to every page. By clicking the Edit mode button, new widgets and buttons will be added to the interface allowing more actions for you. These actions are described below.
User Interface for Interacting with the Plots
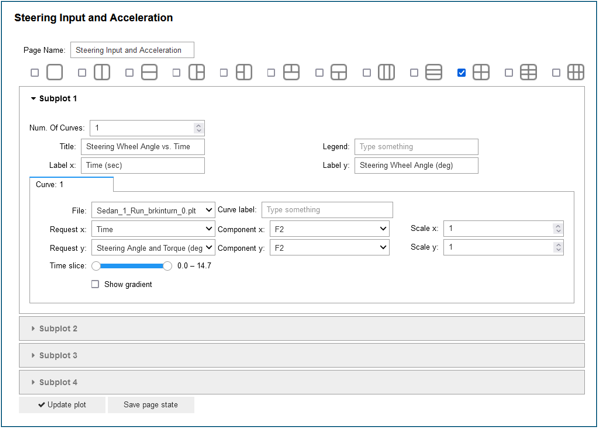
All these widgets are used to modify plotting parameters for every curve and every subplot of the page. This includes layout, names labels and titles, input file, request and component signals, scaling and time slicing. At the bottom are two important buttons. The first one, Update plot, is used to refresh any update that has been done to the input plotting values.
Note that if the current Notebook cell runs again, these changes will be removed unless the second button has been also clicked (Save page state). With Save page state, all the new changes can be saved into the report. Also note that when the document is saved from the Jupyter ribbons (File > Save and Checkpoint) all the pages automatically store the new states of the interface widgets. Autosave is disabled to avoid unexpected override.
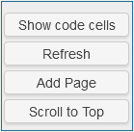
The Show/Hide code cells button will display the input code/markdown cell for the document. This can be used for understanding the report structure as well as to be able to extend the report with custom plots or calculations. Refer to () on how the you could use the data from the loaded .plt to plot custom results. To add new cell from the Jupyter Notebook ribbon click .
The Refresh button is just a shortcut of Run All cells of the Jupyter Notebook’s built-in function. Alternatively, you can use .
The Add Page button provides the option to add a new page above the selected page, including the interface widget for building the plot.
The Scroll to Top button scrolls the document to the index cell.
You can send Jupyter reports as Jupyter Notebook files (ipynb) between users. The important requirements are to include the input plt file(s) in the same directory as the report file and to launch the Jupyter report from Launch Jupyter Report ribbon satellite from inside MotionView. Note that the ability to change and extend the report is not removed while exchanging the report together with the plt.
An additional useful feature of Jupyter reports is the ability to easily export it to PDF from any web browser ().
User Defined Templates
To create a user defined template, it is suggested to start modifying an existing Jupyter report by using the Add Page button. After plotting the required signals, ensure that all the changes have been saved by saving the file, and finally browse the file from the Altair Driver Event’s Entity Editor or from the Generate Report dialog. Note that only plotting pages are treated as template inputs for a new report creation. Any additional code or markdown cells with custom information on the user defined template cannot be included in the newly created report.
Limitations
- Curve manipulation on Jupyter reports is not currently supported (for example: Addition of two existing curves from other pages).
- Jupyter reports are available only for the following events in the current release:
- Full Vehicle Events with Altair Driver.
- Suspension KnC analysis.
- Only plt files are currently supported as input files.
Points to Remember
- While plotting multiple .plt files using a template, the request IDs in these plt files need to be consistent.
- The first plt file’s base name will be used to apply the template when multiple plt files are selected.
- While launching the Jupyter Report from MotionView the necessary environment for Python server is set to correctly display the results. Jupyter reports will not work if you open it as a traditional Jupyter file.
- If you have written your own template for an event, browse the template file from the Event’s Entity Editor and then apply the report.
- The template files for the Jupyter report creation are also Jupyter Notebook files (.ipynb). It is also possible to create user defined templates by modifying and saving a created report file. Make sure that this template will be used with plt files that will contain the specified output request IDs.