Plot Data in HyperGraph
HyperGraph is a data analysis and plotting tool with interfaces to many file formats.
From the HyperGraph menu bar, select one of the following chart types to display the corresponding ribbon. From the ribbon, click an icon to open the related tool.
- Line Chart
-
Figure 1. Line Chart Ribbon 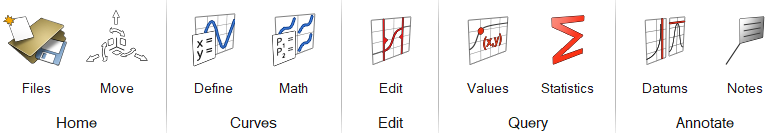
- Bar Chart
-
Figure 2. Bar Chart Ribbon 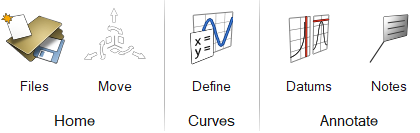
- Complex Chart
-
Figure 3. Complex Chart Ribbon 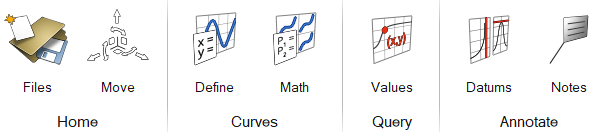
- Polar Chart
-
Figure 4. Polar Chart Ribbon 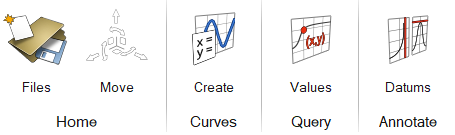
- Vector Chart
-
Figure 5. Vector Chart Ribbon 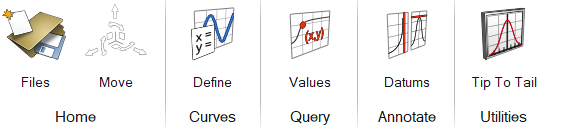
- Radar Chart
-
Figure 6. Radar Chart Ribbon 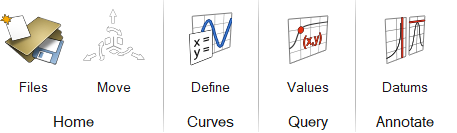
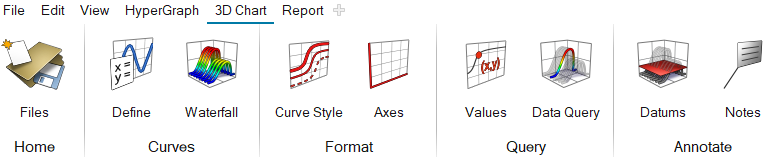
- 3D Chart
-
Figure 7. 3D Chart Ribbon