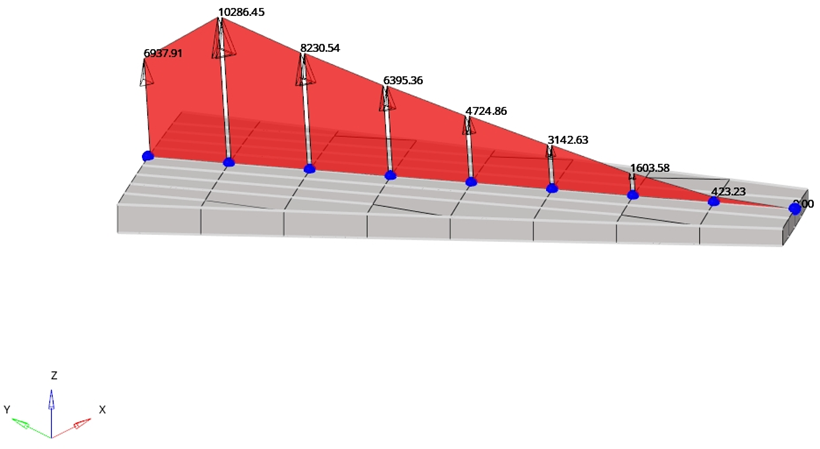
Display free-body forces and moments at each cross-section along a node
path.
From the Post ribbon, click the Trace Plot
tool. Figure 1.
The tool contains the following:
FBD Section Group
Define one or more cross-section groups.
Properties
Shows all properties of a selected FBD section group
Loadcases
List of subcases available inside all imported result files
Trace Plot and Display
Visualization options
The workflow is:
Create a FBD section group
Set the properties of the selected cross-section group
Select a loadcase
Set the options for the trace plot
Display the trace plot for the selected loadcase
Create Free-Body Sections
Right-click and select Create.
A dialog opens.
Name
The name of the FBD section group.
Select Node Path
Select a node path for the FBD section group.
Select Intersect Entity
Select elements of interest along the node path for the FBD section
group. Cross-sections on the FBD Forces tool use all elements
intersecting the plane. However, the Trace Plot tool allows you to
specify what elements will be considered.
Number of cuts between nodes
Defines the amount of extra cross-sections between each pair of
selected nodes.
Cutting plane definition
Defines the normal direction of all cross-sections created by the
Trace Plot tool.
Direction
Available when the cutting plane definition is set to common
direction. Defines a vector to be used as the normal direction for
all cross-sections.
System definition
Defines the system used to evaluate results.
The Direction-Based option allows you to define coordinate systems
at each node automatically. The selection box is used to define a
vector in the XY plane. The system coordinate will be:
X direction is defined automatically by the normal of each
cross-section
Z is defined by the vectorial product of X and the vector is
defined by you
Y direction is the vectorial product of Z and X
All FBD section groups display in the Model Browser.
Set Properties of the Selected FBD Section Group
Select a FBD Section Group.
Its properties display.
Name
The name of the FBD Section Group.
ID
The ID of the FBD Section Group.
Color
The color of the FBD Section Group.
Intersect entity ids
Select elements of interest along the node path for the FBD Section
Group.
System definition
Defines the system used to plot results.
System
Available when the system definition is set to User defined. Selects
a coordinate system to plot results.
Orientation Vector
Available when the system definition is set to Direction based.
Defines the orientation vector to define the XY plane.
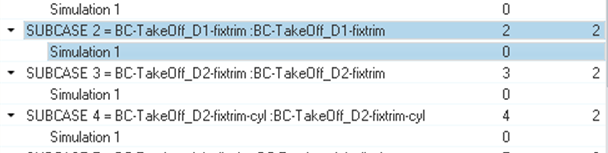
Select a Loadcase
Select a loadcase for the trace plot.
Figure 2.
Trace Plot Visualization Options
Define visualization options for the trace plot.
Load Types
Select what type of free-body data must be shown.
If more than one option is selected forces and moments are summed up.
Options vary depending on the solver.
Tolerance
Forces or moments with an absolute value lower than the tolerance are not
displayed.
Force/Moment
Defines what force or moment component will display.
Arrow Length (%)
Scales trace plot for visualization.
Numeric format
Defines if trace plot values will display in fixed or scientific format.
Also defines the amount of decimal places.
Plot Direction
Selects the direction of the trace plot.
Sum At
Selects if forces and moments will be summed at the centroid or at
nodes.
Display At
Selects if forces and moments will display at the centroid or at nodes.