FBD Panel Plot
Display normal and shear loads of panel structural members.
From the Post ribbon, click the Panel Plot
tool.Figure 1.

Restriction: Only available in the Nastran and OptiStruct
solvers.
Use the guide bar to perform the following workflow:Figure 2.
- Select the option Panel plot.
- Select panel entities.
- Set the options for the panel plot (see below).
- If an envelope is needed, select the option Create envelope and select loadcases.
- Click Play,
 .
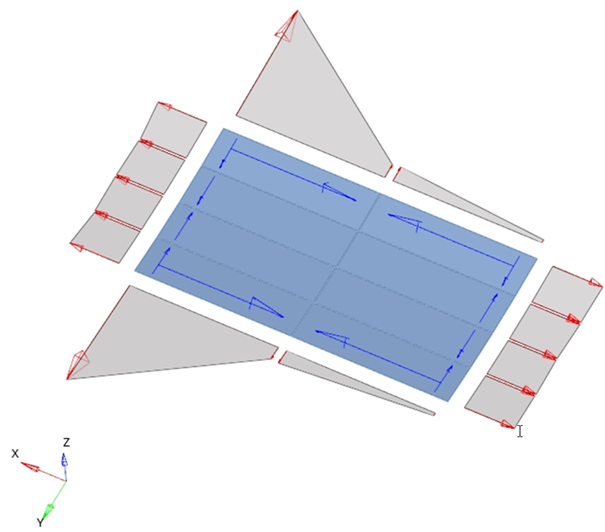
.This display a panel's normal load and tangential loads. A legend is displayed that controls the display status, as well as the color of the loads.
Panel Plot Options
- Evaluate by
- Select what type of data must be shown.
- Tolerance
- Loads with an absolute value lower than the tolerance are not displayed.
- Envelope Options
- If the algebraic type is selected, the tool considers positive and negative values to build up maximum and minimum envelopes.
- Graphic Options
-
- Show values
- Activate the checkbox to display values.
- Arrow Length (%)
- Scales panel plot vectors for visualization.
- Normal Load at
- Select if the normal load will be shown at the center or at the corner of element edges.
- Numeric format
- Defines the numeric format of the values shown.
- Summary Tables
- Creates tables with normal and tangential loads for one or multiple panels and for one or multiple loadcases.
- The summary table shows all normal and tangential loads for panel
entities.
Figure 3. 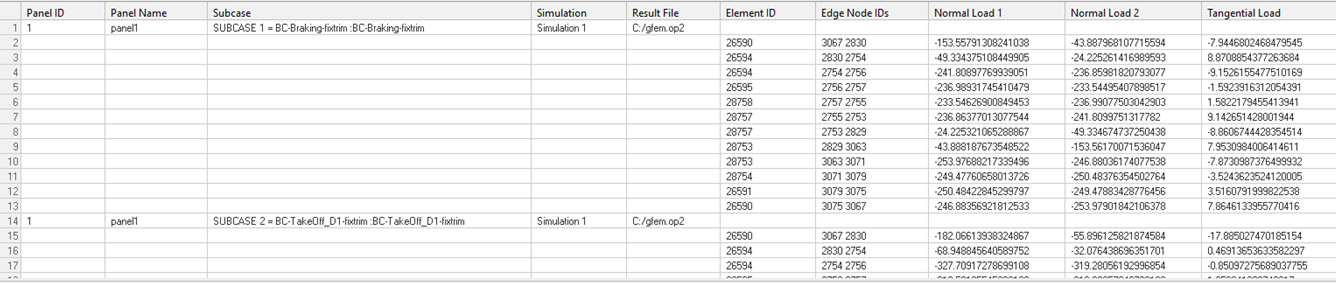
- The min/max table shows minimum and maximum values for normal and tangential
loads.
Figure 4. 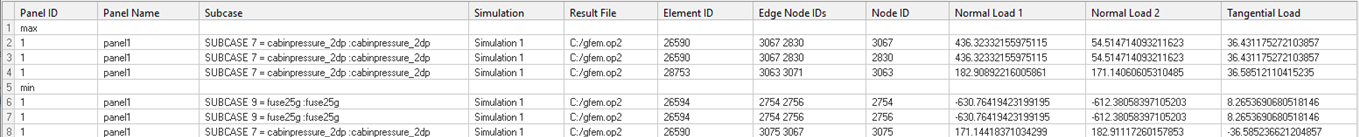
Using the guide bar, complete the following workflow:
- Select the option Report table.
- Select panel entities.
- Select loadcases.
- Click
 to set the options for the panel plot.
 - Click Play, .