Create, Edit, and Display Deformed Plots
Use the Deformed tool to specify parameters for deformation display.
-
From the Post ribbon, click the Deformed tool.
Figure 1. 
- Select a deformed plot using the drop-down menu on the guide bar.
- Optional:
Click the Create Deformed satellite icon to define a new
deformed plot.
Figure 2. 
- Optional:
To review and edit the current plot definition, click
 on
the guide bar.
on
the guide bar.
- Optional:
Select a subset of components or elements on which to apply the plot.
By default, the plot is applied to the entire model.
- Click Plot to display the plot.
-
Click one of the following:
 - Save changes and exit the tool
 - Clear the plot
 -
Exit the tool without saving changes
-
Exit the tool without saving changes
Tip:
- Plots are based on the current load case and step, which can be reviewed and updated from the status bar or the browser.
- Existing plots can also be displayed or cleared using the plot icons in the Results Browser.
- Editing the definition for a displayed plot will automatically update the graphics. For large models, editing the plot definition may be faster if the plot is not displayed.
- Selection
- When a deformation plot is active, window selection is disabled.
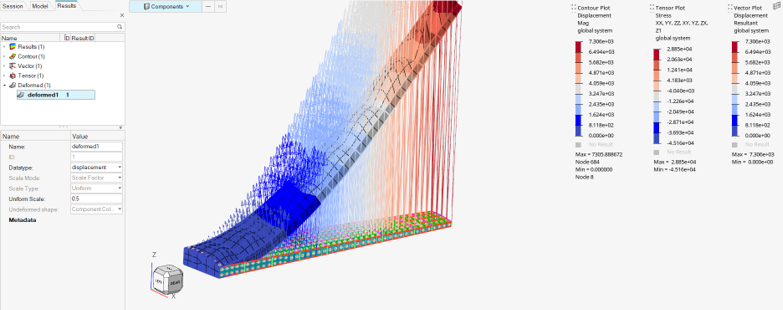
- Tensor and Vector on Deformed
- Vector and tensor are currently always shown in undeformed shape. If
deformation is on and either a tensor or vector plot are displayed, an
undeformed shape (with default component color mode) is displayed and
relevant quantities are drawn using it as reference.
Figure 3.