Create, Edit, and Display Free Body Section Plot
Use the Free Body Plot tool to visualize results of a collection of Free body sections.
- Displacement and rotations on nodes of a collection of free body sections
- Force and moment of a collection of free body sections:
- As resultant on each section
- As free body force acting on nodes of each free body section
- Review the contribution of internal forces and applied forces
- Trace plot force or moment component along a path on top of the model
You can use the Plot workflow to create multiple FBD Plot entities with one active at a time.
-
From the Post ribbon, select the Plot Free-Body
tool.
Figure 1. 
-
From the guide bar, click
 and select a FBD
plot.
and select a FBD
plot.
- Optional:
From the Post ribbon, select the Create FBD Plot
controls satellite tool from the Plot group to define a new FBD
plot.
Figure 2. 
-
Select a subset of free body sections or free body groups to apply the
plot.
Important: The plot will be invalid without this selection.
- Optional:
From the guide bar, click
 to review and edit
the current plot definition.
to review and edit
the current plot definition.
- Click Plot to display the plot.
-
Select one of the following:
- Click
 to save changes
and exit the tool.
to save changes
and exit the tool. - Click
 to clear the
plot.
to clear the
plot. - Click
 to exit the tool
without saving changes.
to exit the tool
without saving changes.
- Click
- Plots are based on the current load case and step, which can be reviewed and updated from the status bar or the browser.
- Existing plots can also be displayed or cleared using the plot icons in the Results Browser.
- Editing the definition for a displayed plot will automatically update the graphics. For large models, editing the plot definition may be faster if the plot is not displayed.
- When inside the Plot tool, displayed components can be controlled from legend: status and color.
Plot Free Body Translation and Rotation
- In the fbdplot dialog, select Translation/Rotation for Section Type.
-
Select the system to resolve the plot in.
- Free Body System: honors the system selection on each free body section entity.
- Global System: ignore settings at entity level and evaluate and plot values on global (basic) system.
- User System: ignore settings at entity level and evaluate and plot values on selected user cartesian system.
- Optional:
Change the Display option for both Translation and Rotation.
- Components: displays arrows of selected components for displacement and rotation.
- Resultant Plane on Direction-1:
- Normal is mapped to X component.
- Tangent is the resultant of Y,Z components.
- Resultant Plane on Direction-2:
- Normal is mapped to Y component.
- Tangent is the resultant of Z,X components.
- Resultant Plane on Direction-3:
- Normal is mapped to Z component.
- Tangent is the resultant of X,Y components.
Note: X,Y,Z are defined by resolved-in system. When Free Body Section is defined by plane, Z is normal to the plane. The tool will display arrows on each nodes of the selected free body sections that represent displacement and rotation components selected.Figure 3. Plot Displacement & Rotations 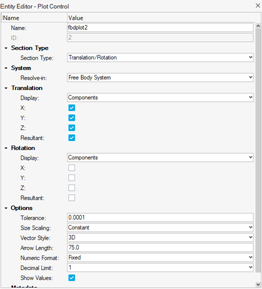
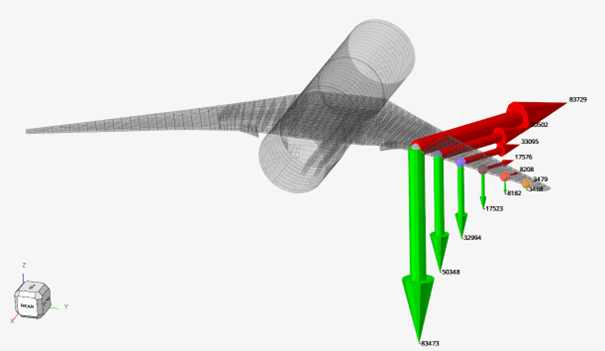
Figure 4. 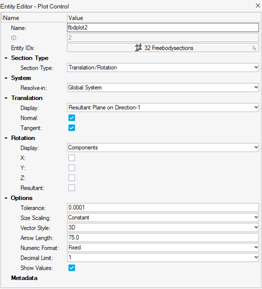
Plot Free Body Forces and Moments
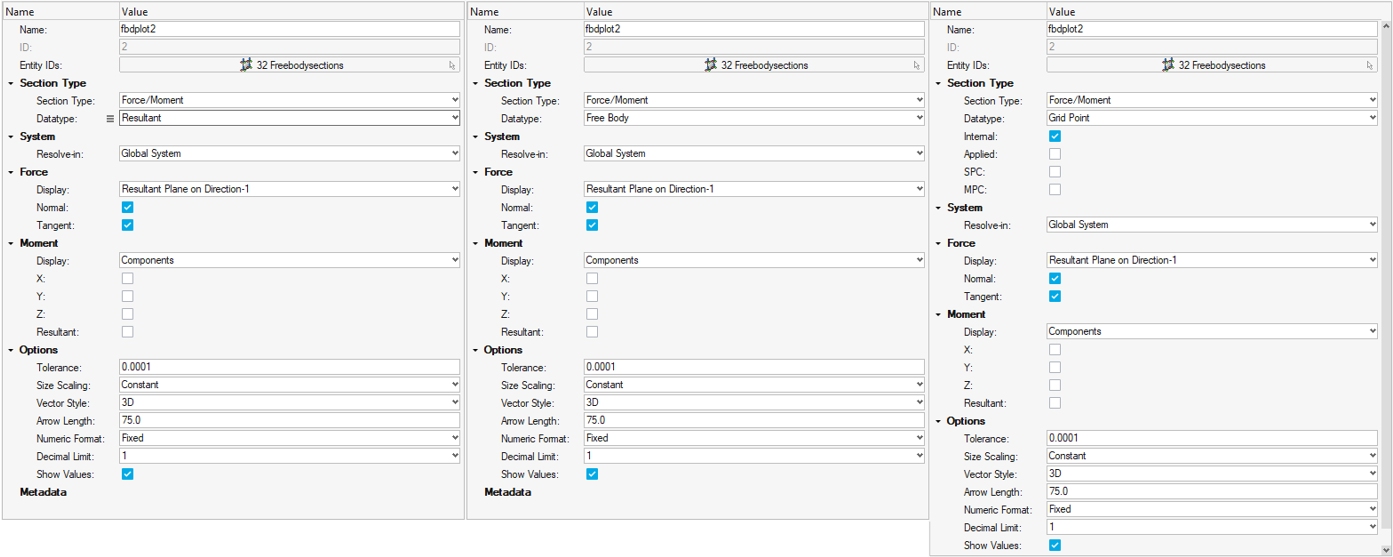
- In the fbdplot dialog, select Force/Moment for Section Type to calculate and plot forces and moments acting of each free body section selected.
-
Select the Datatype to plot.
- Resultant: plot the summed force and moment at summation point.
- Free Body: plot internal forces on each interface nodes.
- Grid Point: plot grid point forces due to the selected contributions.
- Internal forces
- Applied Forces
- SPC forces
- MPC forces
-
Select the system to resolve the plot in.
- Free Body System: honors the system selection on each free body section entity.
- Global System: ignore settings at entity level and evaluate and plot values on global (basic) system.
- User System: ignore settings at entity level and evaluate and plot values on selected user cartesian system.
Important: See System Transformation for Forces and Moments for more information. -
Change the Display option for both Force and Moment.
- Components: displays arrows of selected components for force and moment.
- Resultant Plane on Direction-1:
- Normal is mapped to X component
- Tangent is the resultant of Y,Z components
- Resultant Plane on Direction-2:
- Normal is mapped to Y component
- Tangent is the resultant of Z,X components
- Resultant Plane on Direction-3:
- Normal is mapped to Z component
- Tangent is the resultant of X,Y components
Note: X,Y,Z are defined by the Resolved-in system selection. When Free Body Section is defined by plane, Z is normal to the plane.
Trace Plot Free Body Forces and Moments
- From the guide bar, select Free Body Groups.
- For Config, select Section cuts.
- For Section Type, select Trace Plot.
-
Select the system to resolve the plot in.
- Free Body System: use the system defined the plane of each free body section entity.
- Global System: ignore settings at entity level and evaluate and plot values on global (basic) system.
- User System: ignore settings at entity level and evaluate and plot values on selected user cartesian system.
-
Select Plot Direction.
- Global X,Y,Z: plot vectors in global system along selection axis.
- Plane X: use free body section plane’s X local vector.
- Plane Y: use free body section plane’s Y local vector.
- Local X, Y, Z:
- Available only when resolved-in local system
- Use local system axis to plot vectors
-
Select Sum at.
- Summation point: use each free body section’s summation point position to sum moments.
- Centroid: use each free body section’s centroid to sum moments without changing the free body section’s setting.
Note: When Free Body Group generates Free Body Sections, the position is automatically updated. Changing Sum at to Centroid or Summation Point will not change that value. -
Select Display at.
- Summation point: displays trace plot based on free body section’s summation point position.
- Centroid: Use each free body section’s centroid to sum moments without changing the free body section’s setting.
Figure 7. Trace Plot 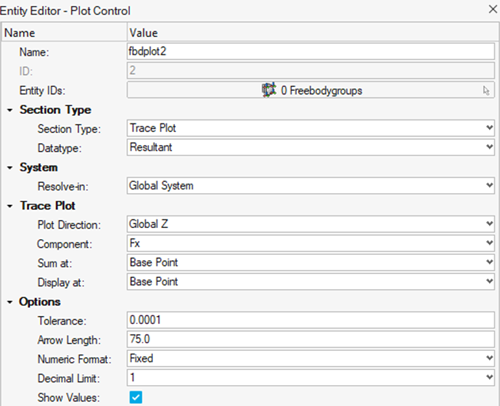
Figure 8. 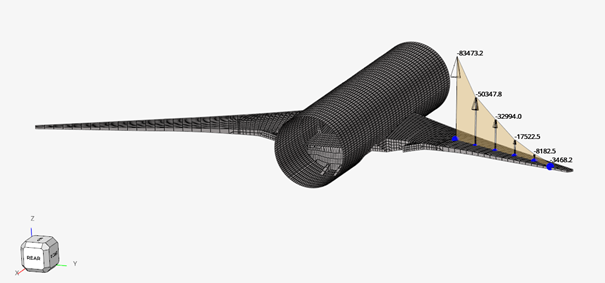
System Transformation for Forces and Moments
Analysis System
Free Body Sections used in a plot for Force/Moment can be mesh based (support==Mesh). As a result, you can set Resolve-in to Analysis system at the entity level.
This means that the system used to extract forces on each node of a Free Body Section will be the output system of the given node, hence can change on a node basis. If the plot requested is the resultant force, then local systems are ignored.
- Results are extracted from file in global system. See Known Limitations with H3D Files generated by OptiStruct prior to 2023.1.
- Node output system is extracted from current session.
- Transformation applies from global to current output system assigned on node.
- A provision is provided to assign new output systems to any node and post process results in that output system no matter what system was used in the run.
- Analysis system will match the solver run analysis system if the current session systems assigned to nodes match with the solver deck used at run time.
Analysis system option generally does not make sense in the event of Resultant plot. Results are always plot along global system even if summation point is set to a Node ID with an output system.
Section Cut System
- Z-axis = Plane normal
- Y-axis = (Plane normal)^(Orientation vector)
- X-axis = (y-axis)^(z-axis)
Usually, the x-axis directly matches with Orientation since the manipulator used to define and edit entity store orthogonal vectors.
Raw results are extracted from result files in global system then transformed to plane local system.
Known Limitations with H3D Files
OptiStruct native *.h3d file has a known limitation. Results are always saved in an *.h3d file as X,Y,Z components output in the node’s output system, but there is no information of such system in result file. All transformations mentioned above rely on a reader that can give raw results either in output system or global system. Hence, a further transformation may apply. OptiStruct 2023.1 fixed this issue. Now when output FPFORCE(ALL,FBD) is requested, OptiStruct will directly write data in Basic system which will be used to perform the proper transformation.
When working with an older version of OptiStruct, it is recommended to not use *.h3d files if nodes are used later in Free Body Sections and have output system assigned. This limitation does not apply to *.op2 and *.hdf5 files if model information is saved in the file too.