Query Results
![]()
Introduction
The Query Result tool allows you to inspect and export numerical result values for selected entities such as nodes, elements, or points.
After a contour plot has been created in the graphics area, this tool can be used to display the corresponding result values in a tabular format.
Accessing the Tool
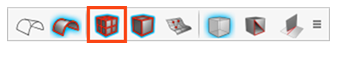
You can access the Query Result tool in one of the following ways:
- From the Results ribbon, click Query Result in the Results group.
- Or right-click in the graphics area after plotting a contour and select Query Result from the context menu.
When the dialog opens, the Element Edges option in the Model View Options (available from the View toolbar) is automatically activated.
This allows you to directly select nodes or elements in the graphics window.
Once the tool is active, you can select entities such as nodes, elements, or points in the graphics area. Their corresponding result values—based on the settings currently defined in the Result panel (such as simulation step or component)—are displayed in a table within the dialog.
Using the Tool
The behavior of the Query Result tool depends on the type of entities you select.
You can query results on nodes, elements, or points.
The table automatically updates each time you change your selection in the graphics window.
If you modify options in the Result panel (for example, by changing the simulation step or result component), the table is refreshed automatically to reflect the updated values.
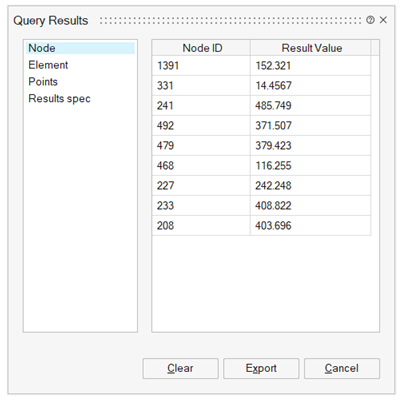
Querying Node Results
When nodes are selected, the tool displays the node ID and the corresponding result value for the current settings in the Result panel.
If the Averaging method in the Result panel is set to Not averaged, and if the displayed results are elemental results extrapolated to nodes, the table shows each selected node ID, its associated element IDs, and the result value of that node within each element.
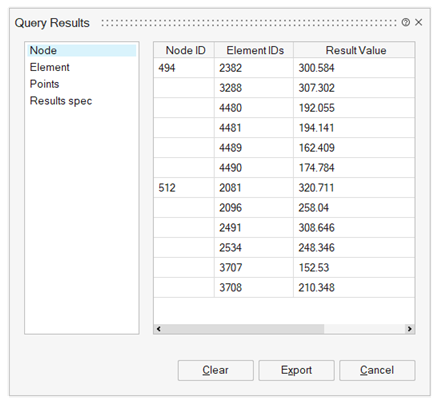
This option is available only for results stored in H3D files or for results imported using the new results reader.
For more information about the new results reader and how to enable it, refer to the section under File > Preferences > Results.
Querying Element Results
When elements are selected, the table lists the element ID, the node IDs belonging to each selected element, and the result value for each node of the element.
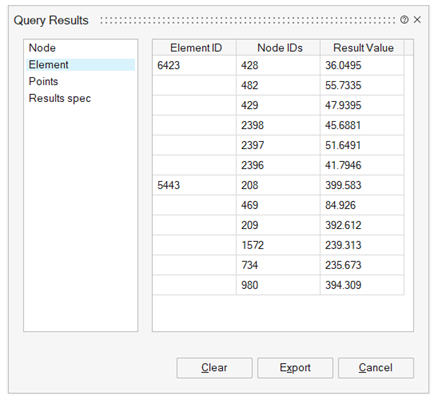
If the element result contains a single value per element (for example, a centroidal value), the same value is displayed for all nodes of that element.
Querying Point Results
The Point option provides multiple ways to query results at specific locations on the model.
This mode is especially useful for inspecting result values at arbitrary positions or predefined coordinates.
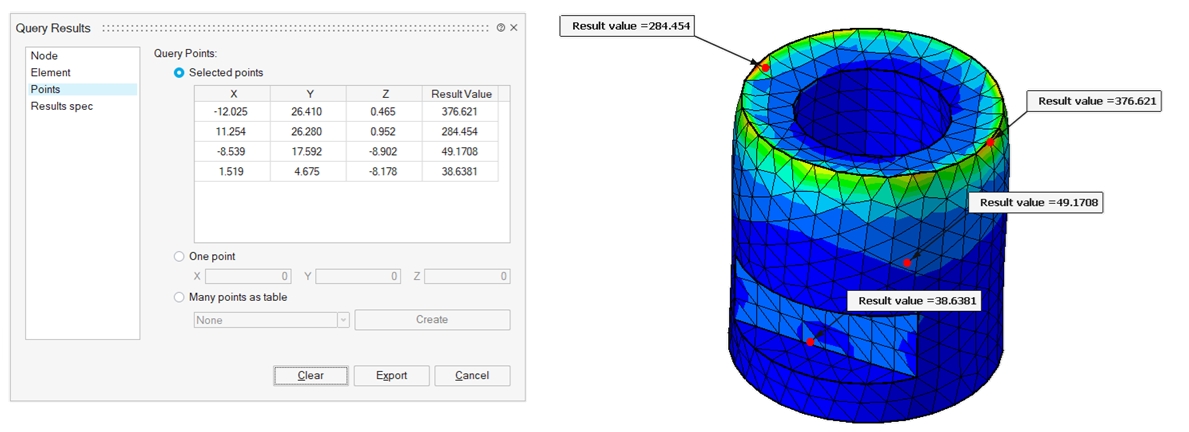
Selected Points
This option allows you to click anywhere on the model surface to view the corresponding result value.
The displayed value is interpolated from the surrounding entity results to represent the result at that exact location.
The coordinates and result value are shown in the Query Result dialog, and a marker is displayed at the selected point in the graphics window.
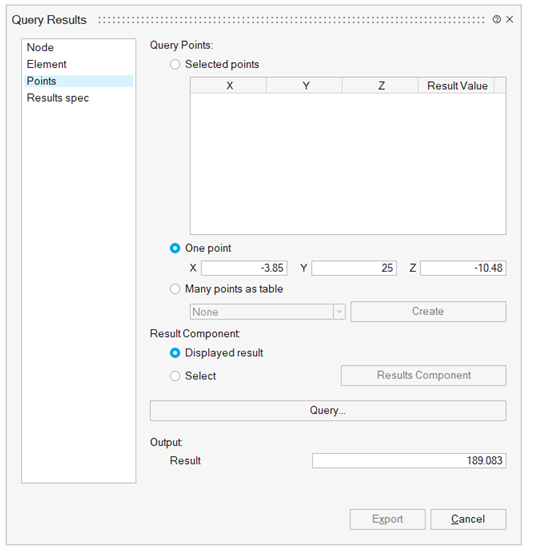
One Point
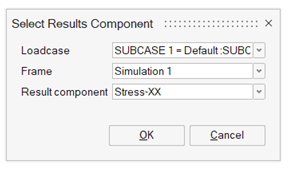
When the One Point option is selected, a Result Component section appears in the dialog, offering two choices:
- Displayed Result – extracts the result corresponding to the settings currently active in the Result panel.
- Select – allows you to click the Result Component button and choose another result to query.
In this mode, you must manually enter the XYZ coordinates of the point of interest.
After entering the coordinates, click Query to interpolate the result value at that position.
The extrapolated value is displayed in the Output area of the dialog.
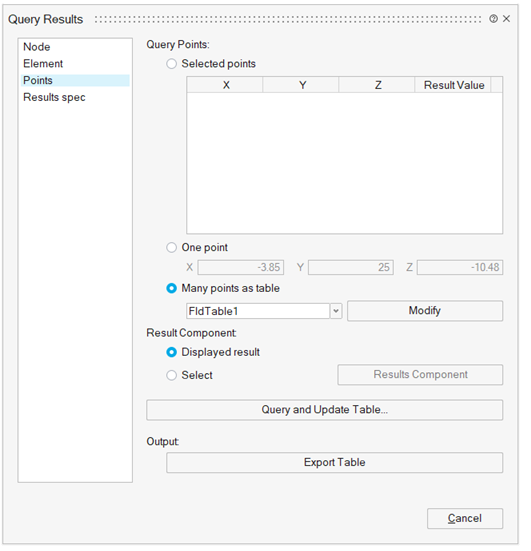
Many Points as Table
When the Many Points as Table option is selected, the Result Component section again appears with the same two choices: Displayed Result and Select.
You must then select or define a Field Table that lists the coordinates of the measurement points.
Each row in the table corresponds to one point and contains its XYZ coordinates, while the last column is reserved for the extrapolated result value, which is updated in the next step.
Once the table and result component are defined, click Query and Update Table.
This updates the table by filling in the extrapolated values in the last column.
The updated table can then be exported in CSV format by clicking Export Table from the same dialog.
Exporting Query Results
To export the data displayed in the Query Result table, click the Export button in the dialog.
The table is saved as a CSV file, which can be opened in any spreadsheet or text editor.
This export method applies to all entity types—nodes, elements, and points—except when using the Point option with Many Points as Table.
In that case, export must be performed directly from the Field Table dialog using its own Export Table option.
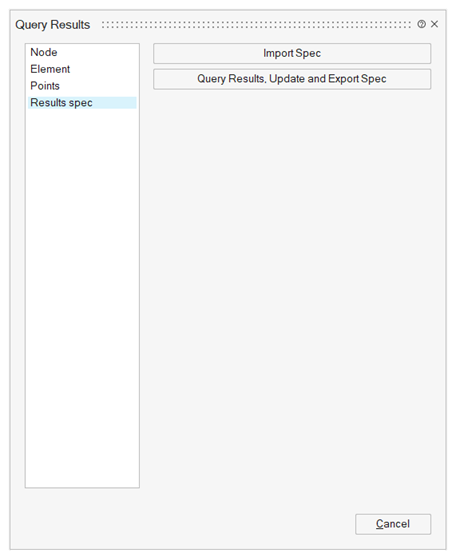
Result Specs
The Results Spec option was previously used to extract the minimum and maximum result values over a selected set of entities.
This option is now obsolete and no longer recommended.
To obtain minimum and maximum result values, use Responses, which provide a more flexible and up-to-date method for computing and tracking such quantities.