XY Plot
![]()
Dialog Box
The current displayed result component for selected nodes can be plotted along the X and Y-axes. The selected Node Ids and the magnitude of the result in each node are displayed in the table as X-Data and Y-Data.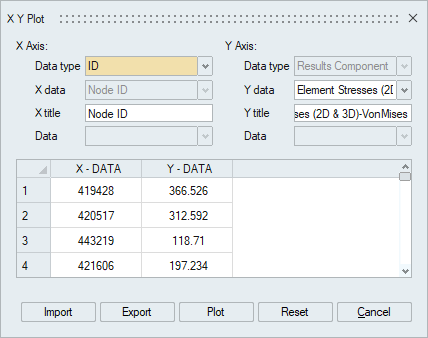
Import / Export
- Import: Import the graph data using csv file format.
- Export: It will export graph data as csv file format.
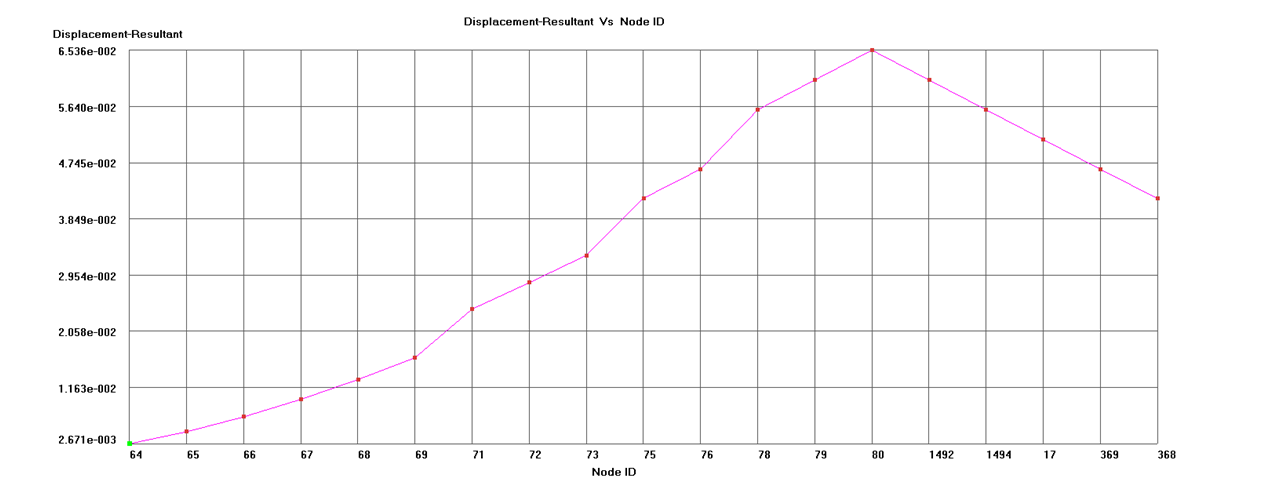
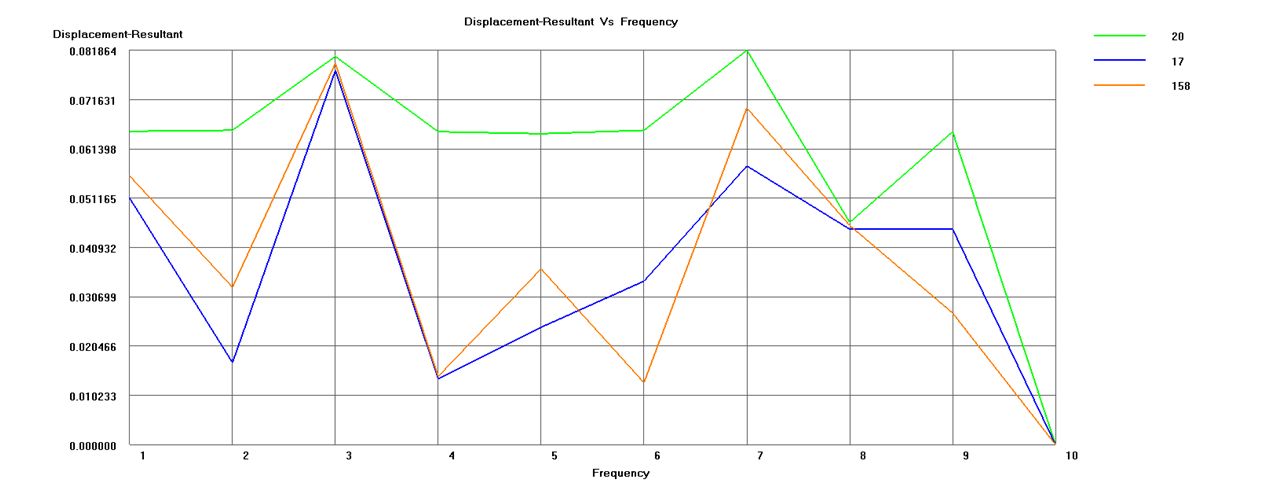
Sample XY Plot
Type of Plots
- Node Id Vs Results component
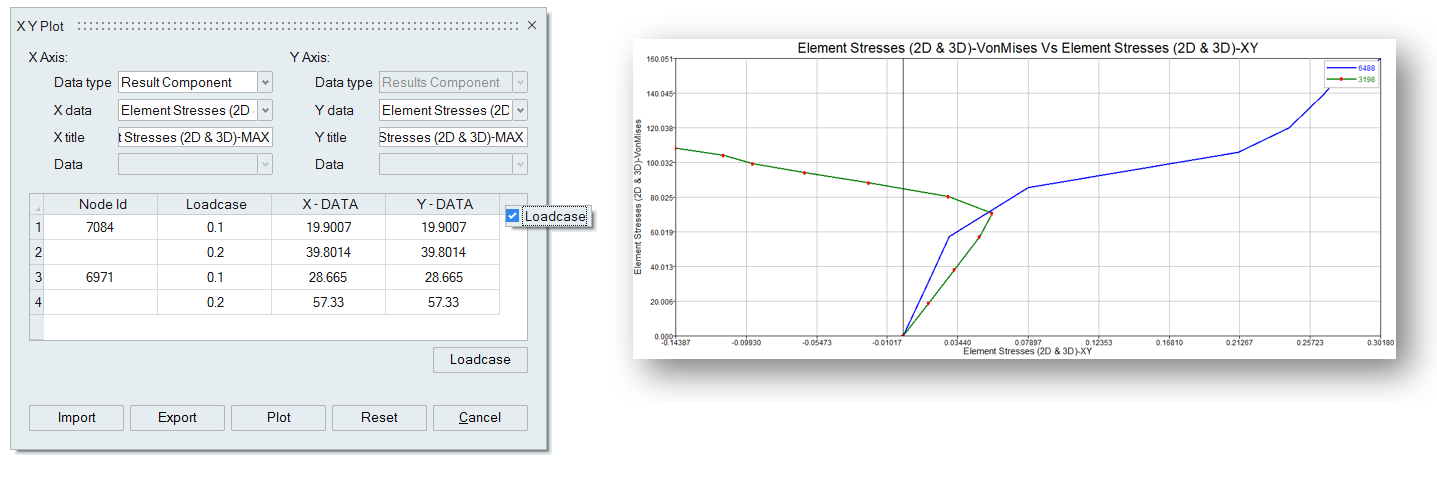
- Results component Vs Results component
The required result components in the respective axes should be selected from the X-Data and Y-Data combo boxes. This will plot the graph for selected nodes.
For transient results, option added to select the load cases and plot the curve for results data vs data with selected load cases / time step. Right click on the table header will show the loadcase option.
- Node XYZ Vs Results component
- This will plot the graph for selected node XYZ location along with selected results component for selected nodes
- Loadcase/Frequency Vs Results component
This type of plot will have a separate curve for each nodes.
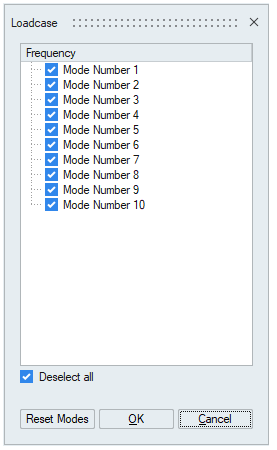
The dialog list out the available load case / frequency from input results file, we should select the required load cases.
Reset
To clear all data in selection grid