Plot Preferences
To modify the plot style of all plots globally, adjust the plot style settings.
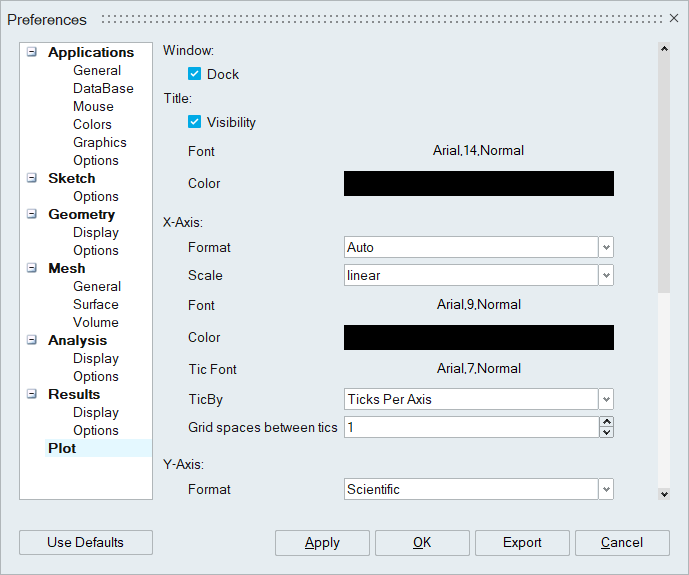
Window
- Dock: Enabling this option will dock the floating plot window to the main window while disabling it will undock the plot window from the main window.
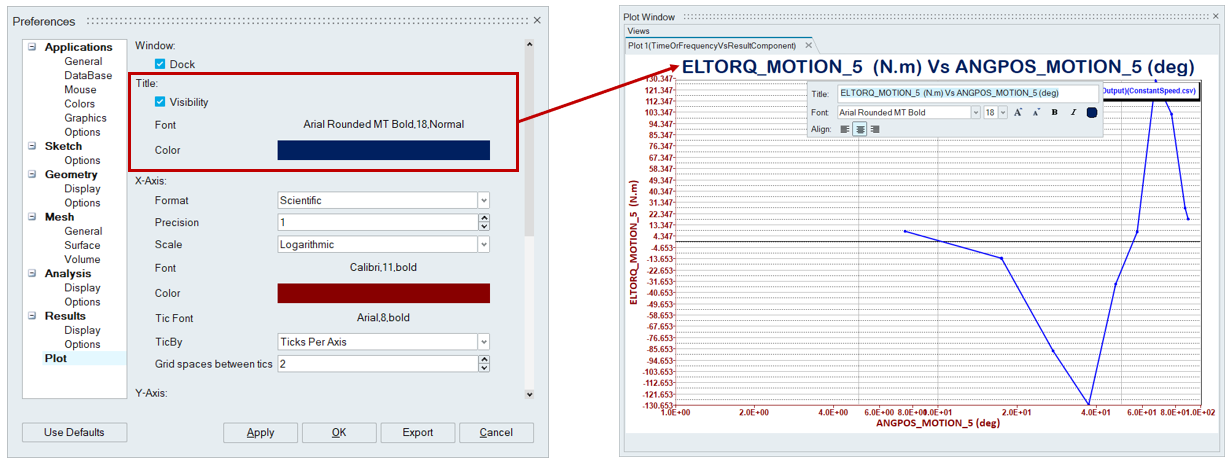
Title
- Visibility: Enable/Disable this option to show/hide the title of the plot.
- Font: Change the font format, size, and style of the title.
- Colour: Set the colour of the title.
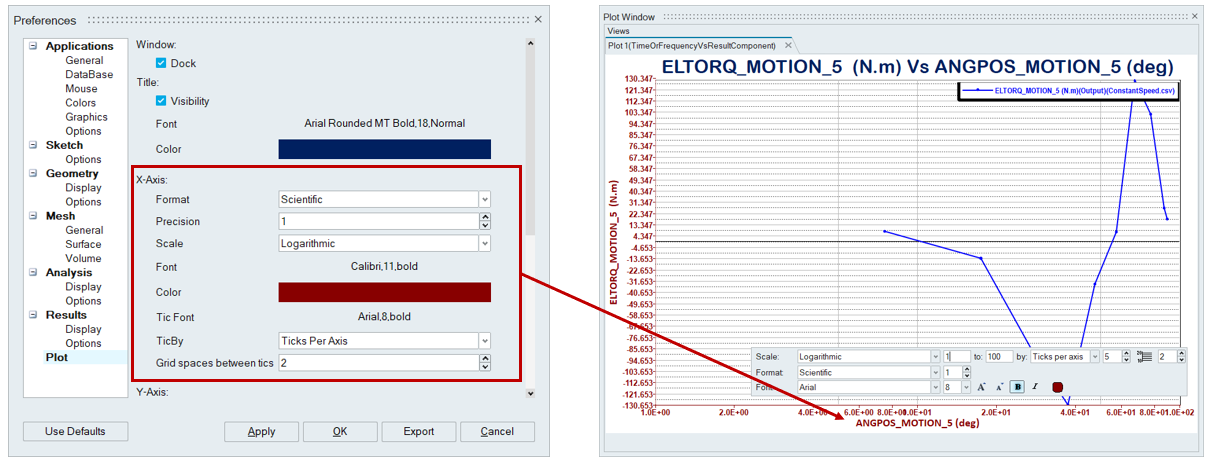
X-Axis/Y-Axis
- Format: Change the format of the axis values (Auto, Scientific, Fixed).
- Scale: Change the scale of the axis.
- Font: Change the font format, size, and style of the axis labels.
- Colour: Change the colour of the axis labels.
- Tic Font: Change the font format, size, and style of the tic marks.
- TicBy: Choose a method for the number of tics in the axis (Ticks Per Axis, Tick Increment) options. Custom tick values can be set only on the linear axis of 2D plots.
- Grid Spaces between tics: Set the number of ticks on the axis based on TicBy.
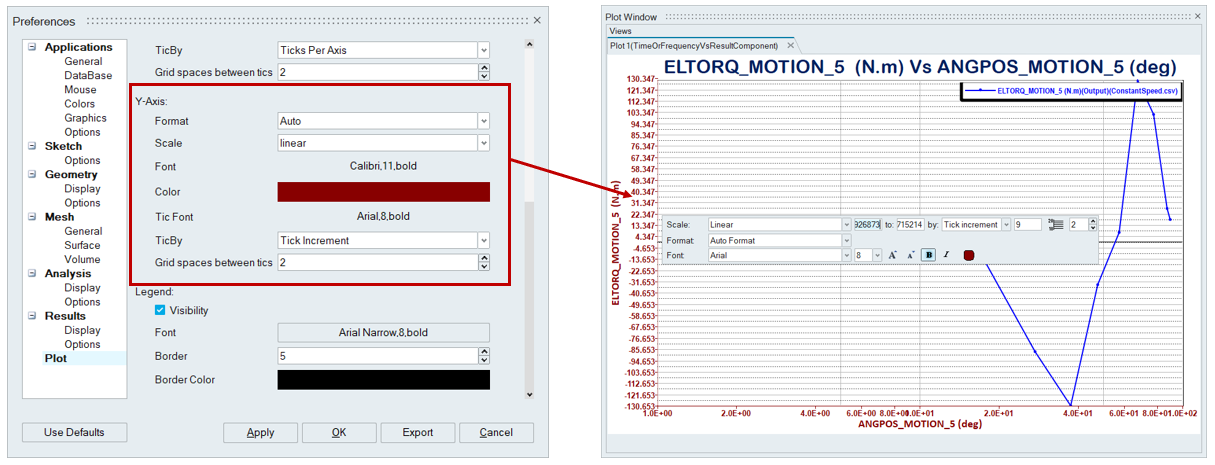
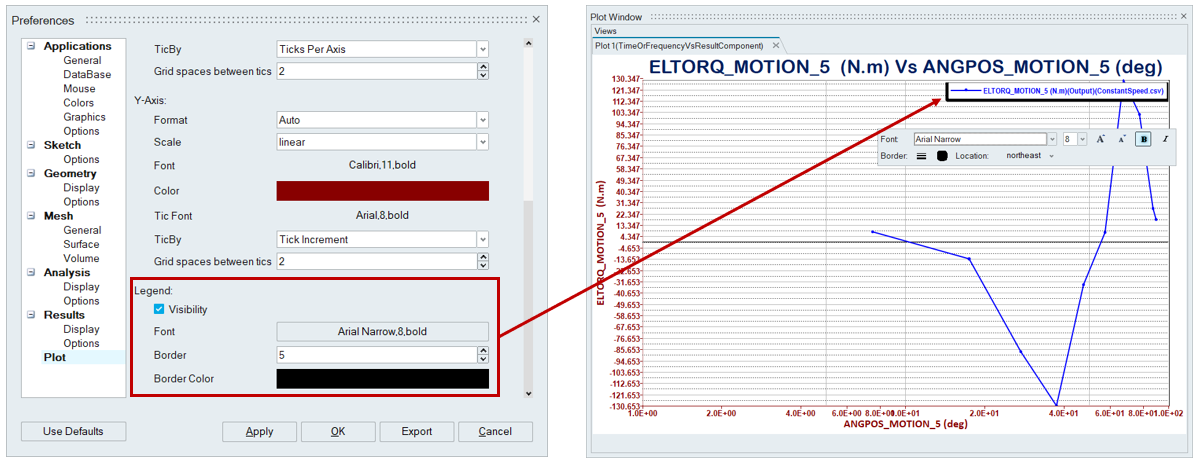
Legend
- Visibility: Enable/Disable this option to show/hide the title of the plot.
-
Font: Change the font format, size, and style of the legend.
- Border: This option is used to set the thickness of the border in the legend bar.
- Border Colour: This option is used to set the border colour to the boundary of the legend bar.
Script Support:
- Users can record the style settings of a plot and use them to draw and capture the graph.