ECM Parameter Fitting
![]()
Description
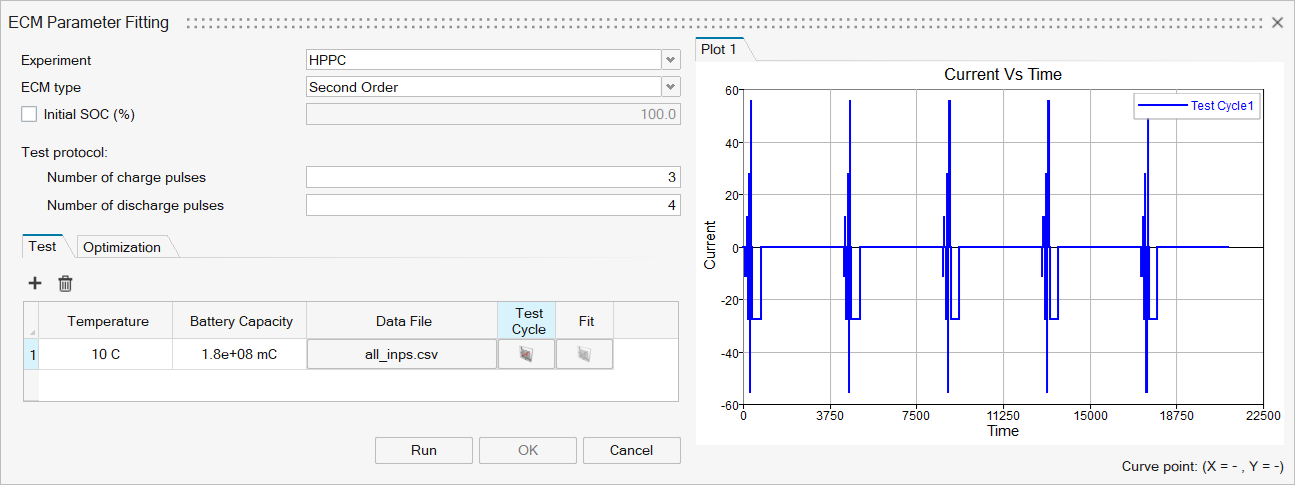
The ECM Parameter Fitting tool provides an interface to fit ECM models up to third order using transient current and voltage data from pulse-discharge/charge experiments, such as Galvanostatic Intermittent Titration Technique (GITT) or Hybrid Pulse Power Characterization (HPPC).
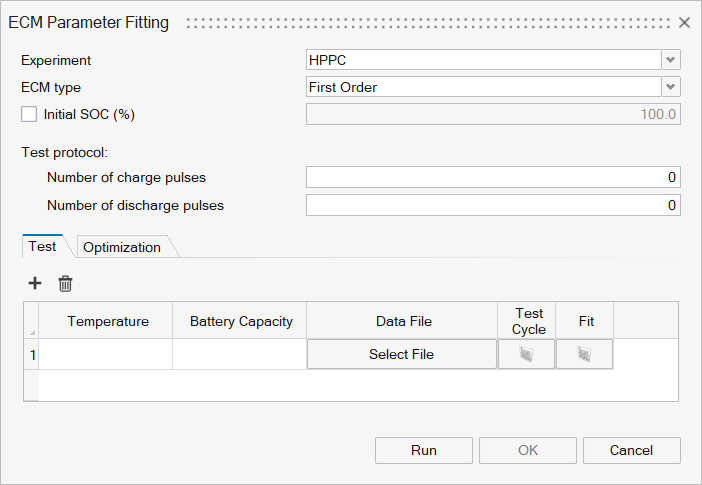
Experiment
This option will specify the type of experiment that generated the input data. Parameter fitting is supported for HPPC and GITT experiments.
ECM type
User can specify the order of ECM model to fit. Three types of ECM models are supported: 1st, 2nd, and 3rd order. The choice of model order depends on the desired dynamics. The 2nd and 3rd order models offer enhanced accuracy for pulse-discharge experiments and dynamic current scenarios. The order of the ECM model must match the order selected in the Circuit Model.
Initial SOC (%)
The percentage of the cell’s total capacity that is charged at the beginning of the test.
Test Protocol
The pulse sequence that defines a single cycle in an HPPC test. A typical cycle includes a combination of charge pulses, discharge pulses, rest periods, and a long discharge pulse used to reduce the cell’s State of Charge (SOC) before the next cycle begins.
- Number of charge pulses
The total number of charge pulses applied within a single HPPC test cycle.
- Number of discharge pulses
The total number of discharge pulses in a single HPPC test cycle. This includes both short-duration pulses and a longer discharge step intended to reduce the SOC between cycles.
The figure below demonstrates a single cycle with the pulse sequence in the cycle labelled. In this case, the number of charge pulses is 3 and discharge pulses is 4.
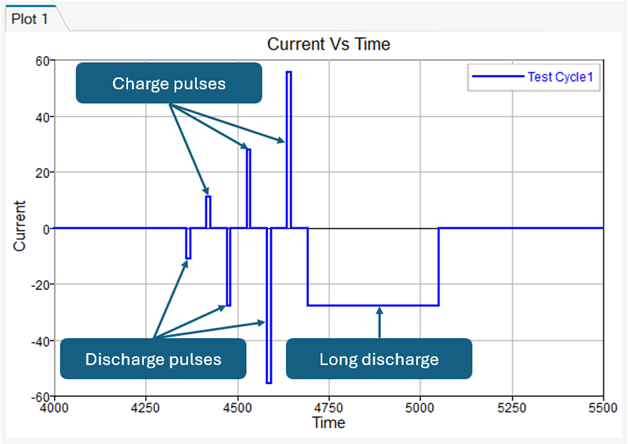
A single cycle of an HPPC test illustrating charge pulses, discharge pulses, and a long discharge step for SOC reduction. Periods of zero current indicate rest intervals between pulses. In the above there are three charge pulses and four discharge pulses.
Test
The Test tab allows users to input data for the full HPPC test across multiple cycles. The figure below illustrates the input for a single test. Multiple tests conducted at different temperatures can be added or removed depending on the available dataset.
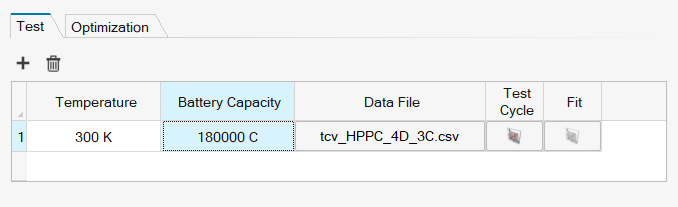
Table input description
- Temperature
The temperature at which the HPPC or GITT test was conducted.
- Battery Capacity
The rated or measured capacity of the battery used during the HPPC or GITT test.
- Data File
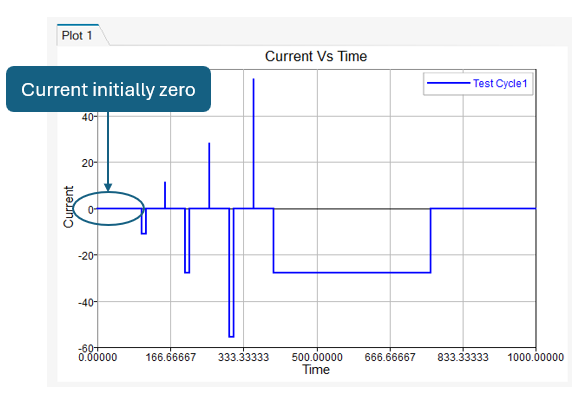
A comma-separated values (CSV) file containing time, current, and voltage data collected during the HPPC or GITT test. As a standard assumption for the fitting process, the initial current is zero and must be reflected in the experimental data e.g.
- Test Cycle
A visualization of the current vs. time, useful for reviewing the test protocol for HPPC data.
- Fit
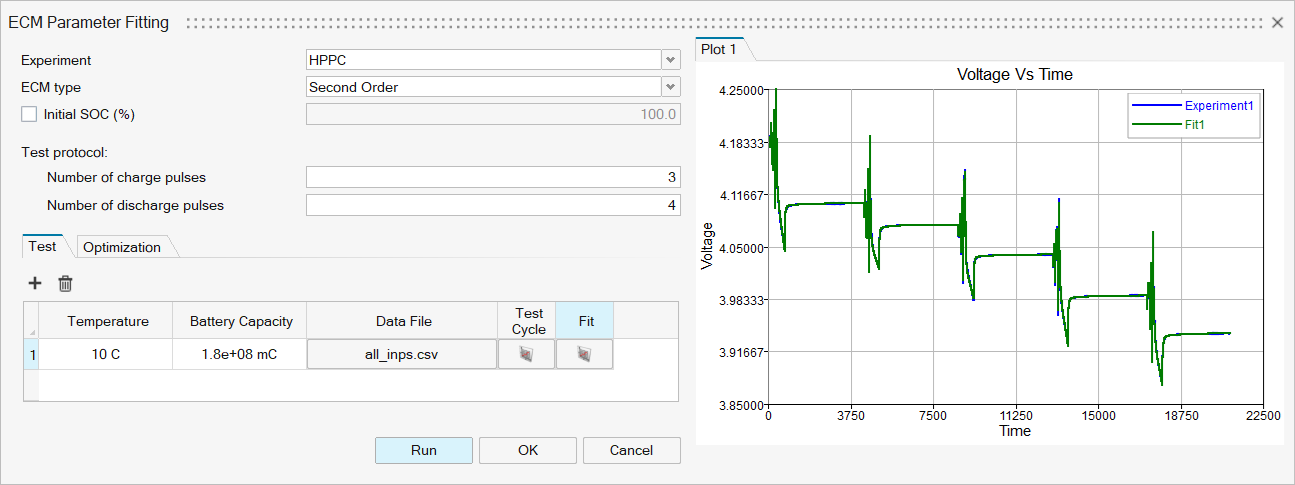
The equivalent circuit model fit plotted alongside the original experimental data to allow for visual comparison and validation.
Optimization
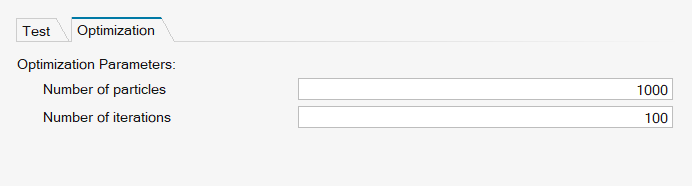
The Optimization tab allows users to configure parameters for the Particle Swarm Optimization (PSO) algorithm. This algorithm, combined with a simplex method, is used to fit the Equivalent Circuit Model parameters within each State of Charge band/ individual test cycle. Two parameters are available to adjust, although they typically do not need to be changed:
- Number of Particles
Number of particles used in the search; increasing makes the fitting more accurate but slower.
- Number of Iterations
Number of search iterations; increasing makes the fitting more accurate but slower.
The figure below demonstrates the input dialog for the above-mentioned options.
Example
Input
Output