Modify Results Plot
Adjust the display attributes for the results plot.
- In the Project Tree, open the Analysis Workbench.
-
In the Analysis Workbench
toolbar, click
 Results plot.
-
In the drop-down menu, click the desired plot.
The Legend dialog will open, and the chosen contour plot will appear in the modeling window.
Figure 1. 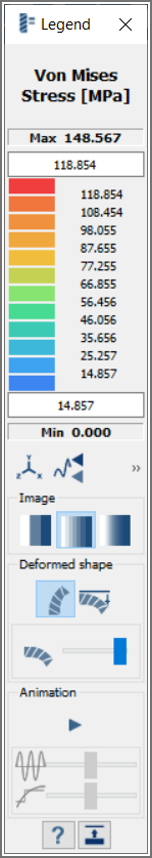
-
Control the contour bounds.
-
Use the Max and Min text
boxes to set upper and lower contour bounds.
Figure 2. 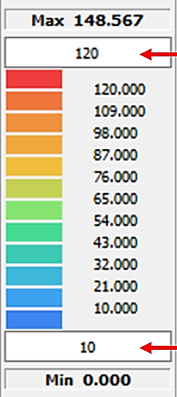
-
Use Set Output Coordinate System
 to visualize the
change in results based on the local coordinate system created.
to visualize the
change in results based on the local coordinate system created.
Figure 3. 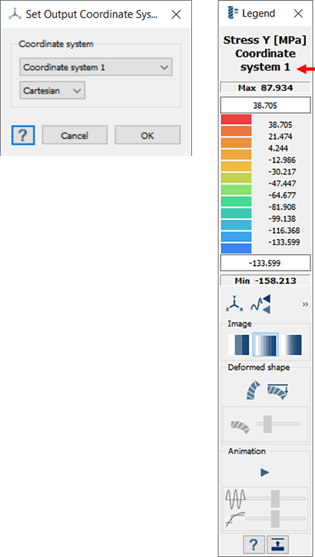
Note: Set Output Coordinate System works for static, modal, and dynamic analysis. -
Click
 to show the maximum and
minimum labels in the modeling window.
to show the maximum and
minimum labels in the modeling window.
-
Click
 to
lock the maximum and minimum contour bounds.
to
lock the maximum and minimum contour bounds.
-
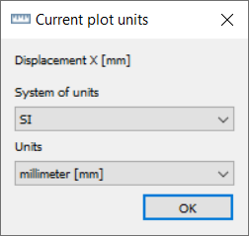
Use Set Output Units
 based
on the requirements to visualize the legend magnitude. The units are
shown with respect to the type of result selected.
based
on the requirements to visualize the legend magnitude. The units are
shown with respect to the type of result selected.
-
Use the Max and Min text
boxes to set upper and lower contour bounds.
- Under Image, set the contour colors.
-
Click
 (Show deformed shape contour plot) to show deformed
shapes in the modeling window.
(Show deformed shape contour plot) to show deformed
shapes in the modeling window.
-
Change deformation scale factor.
-
Click
 (Change max deformation).
- In the dialog, clear the Default check box and either adjust the slider, enter a scale value into the text box, or use the arrows to increment the scale factor as desired.
- Optional: Clear the Default check box and enter a scale value of 1.0 to set deformation to true scale.
Tip: For best practices, refer to Deformation Scale Factor and Visual Artifacts. -
Click
-
View/adjust the Animation.
-
Click
 (Play) to play the animation.
The slider will show the current frame of the animation:
(Play) to play the animation.
The slider will show the current frame of the animation:Figure 4. 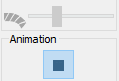
-
Click
 (Stop) to stop the animation.
-
Use the Animation Speed and Animation
Step sliders to adjust the speed and frames displayed in
the animation.
Figure 5. 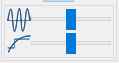
Note: These sliders are only active when the animation is playing.
-
Click
Deformation Scale Factor and Visual Artifacts
In SimSolid, the deformation scale factor is a visualization tool used to exaggerate the displacement of a model after analysis. This is especially useful for results where the actual physical deformations are very small and would otherwise be invisible.
However, it is crucial to understand that scaling is a post-processing visual effect and does not change the analysis results. Using high scale factors can create visual artifacts that may be misleading if not interpreted correctly. The underlying solution remains physically accurate, but its graphical representation can become distorted.
How the Deformation Scale Factor Works
The software first solves the analysis to find the displacement vector, d , for every point in the model. When you view the deformed shape, the new position for each point is calculated by simply scaling this displacement vector and adding it to the original position.
Pscaled = Poriginal + (d * Scale Factor)
This calculation is performed for each point independently. The software does not re-evaluate contact conditions or geometric interactions for the scaled view. This is the source of the potential visual artifacts.
Common Visual Artifacts at High Scale Factors
- Apparent Part Penetration (with separating/closing contact)
- When two parts are defined with separating/closing contact, the analysis
correctly prevents them from passing through each other.
- At a Scale Factor of 1.0: The visualization accurately
shows the true deformed shape, and you will see no penetration
between the parts.
Figure 7. 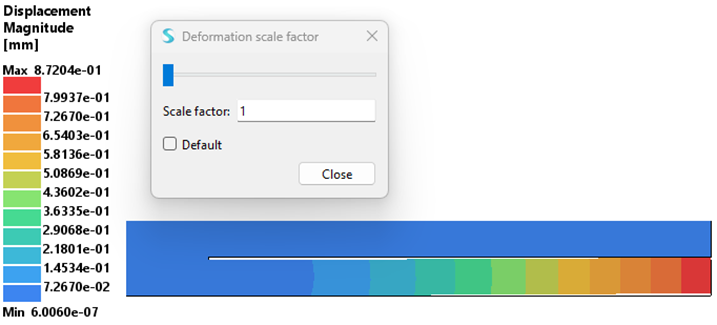
- At a High Scale Factor (for example, 10.0): The
independent scaling of each part's displacement can cause them
to appear to pass through one another in the modeling window. This is not a
reflection of the analysis result, which correctly honors the
contact condition. It is purely a graphical artifact.
Figure 8. 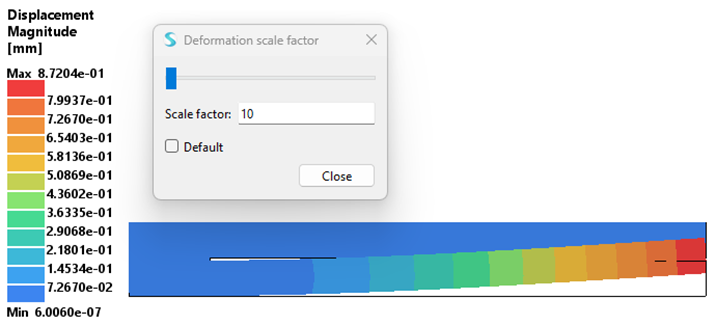
- At a Scale Factor of 1.0: The visualization accurately
shows the true deformed shape, and you will see no penetration
between the parts.
- Apparent Material Thickening or Distortion (with bonded contact)
- When parts are bonded, the nodes at the interface are connected.
Figure 9. 
- At a Scale Factor of 1.0: The deformed shape shows the
parts stretching or bending together realistically.
Figure 10. 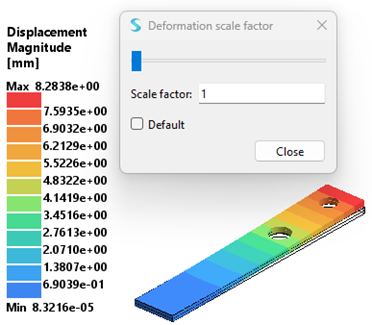
- At a High Scale Factor (for example, 50): The exaggerated
movement of nodes away from the original geometry can make the
connection area or the entire part appear artificially
"thickened" or distorted. Again, this is a visual effect caused
by stretching the geometry along the displacement vectors, not a
true representation of the material's final state.
Figure 11. 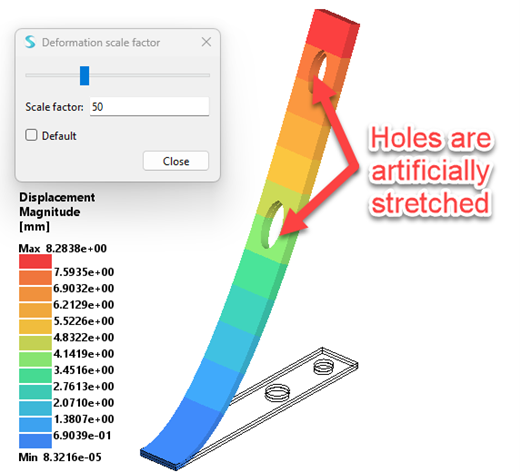
- At a Scale Factor of 1.0: The deformed shape shows the
parts stretching or bending together realistically.
Conclusion and Best Practices
- For Qualitative Review
- Use a high scale factor to easily understand the mode and direction of deformation. It is excellent for quickly grasping how a structure is behaving (for example, "is this beam bending or twisting?").
- For Quantitative Assessment
- To check for the true, physically accurate final state of the model, always set the deformation scale factor to 1.0. This is essential when you need to verify results like contact, clearance, or potential part penetration.
The visualization at scale factors greater than one is a post-processing tool and should be used with caution and awareness of these potential graphical artifacts.