This section briefly explains a Full truck with driver model.
Follow the steps in the Build a Heavy Truck Model topic using the
Assembly tool to build a Full truck with driver model. After building the model, the
following model is displayed in the modeling window.Figure 1.
Events
The section explains how to add an event to the full truck model. Currently, the
following event types are available:
Constant Radius
Single Lane Change
Double Lane Change
Swept Sine
Straight Line Acceleration
Straight Line Braking
Sinusoidal Steering
BrakeIn Turn
J Turn
Throttle off cornering
Swept Steer
Pulse Steer
Throttle off TurnIn
Step Steer
Power off ln Straight Line
Altair Driver File
Road Course
nPost
Each event has different options and inputs required. For example, the Constant
Radius event is explained in the following steps.
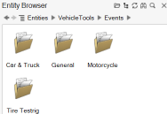
Click the Events icon under the Modeling ribbon, to access the Events folder in the Entity
Browser.
Figure 2.
Go to the Car & Truck folder and double-click on the
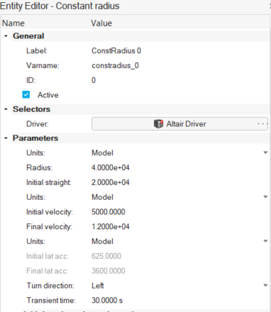
ConstRadius icon . The event will be added to the model and its
properties is listed in the Entity Editor.
Figure 3.
Set the event parameters under the Parameters
section.
Set the simulation parameters under the Simulation
Settings section.
Note: Other settings such as Signal settings and
Controller settings may be reviewed and changed. Refer to Event
documentation for more details.
The event is ready to run.
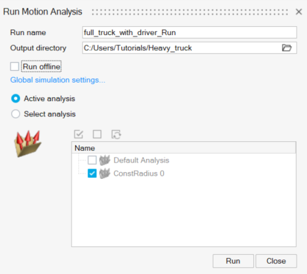
In the Solutions ribbon, click the Analysis settings
dialog satellite icon on the Run icon to open the Run Motion Analysis
dialog.
Figure 4.
Provide a Run name and an Output
directory.
Optionally, click Run offline to run the model through a
separate solver process.
Click the Run button.
MotionSolve is invoked and it displays the Run
status window (or the solver window if running offline) with progress as it
runs.
Note: Run files will have the event’s variable
name appended to the Run name.
The generated file types are
.adf, .plt, and
.h3d files.
Click on the Reports ribbon icon under the Solutions group to bring up the View
Reports dialog.
Select the report row corresponding to the event and click
OK to generate plots and animation.

 under the Modeling ribbon, to access the Events folder in the Entity
Browser.
under the Modeling ribbon, to access the Events folder in the Entity
Browser.
 . The event will be added to the model and its
properties is listed in the Entity Editor.
. The event will be added to the model and its
properties is listed in the Entity Editor.
 on the Run icon to open the Run Motion Analysis
dialog.
on the Run icon to open the Run Motion Analysis
dialog.
 under the Solutions group to bring up the View
Reports dialog.
under the Solutions group to bring up the View
Reports dialog.