This section explains briefly how to build and generate reports for a model built in
the Truck Library.
For example, follow the steps in the Front end of truck section to build a Front suspension
model using the Assembly Wizard. At this point, you have built a complete front
suspension.
Features in the model
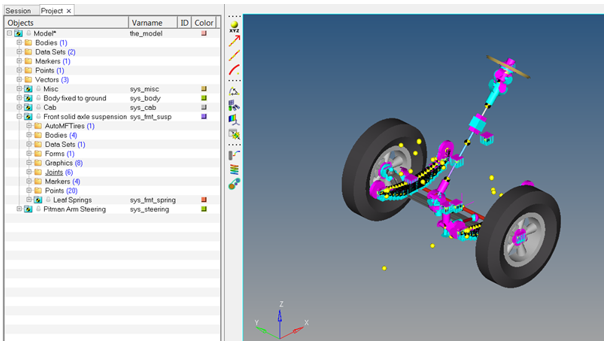
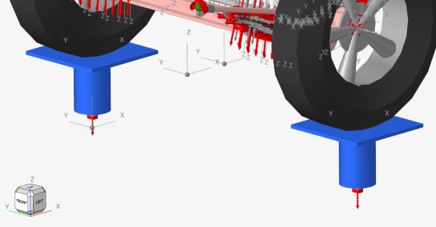
After building the model, the following model is displayed in the graphics area.Figure 1.
The model has the following features:
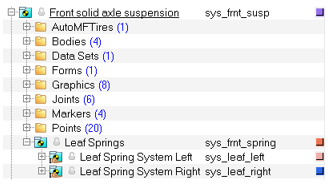
Front solid axle suspension has the Leaf springs as a subsystem. The strut, stabilizer
bar, and jounce and rebound systems are grouped under the suspension systems.Figure 2.
Pitman Arm Steering is a separate system with the steering column as a subsystem.Figure 3.
Individual systems can be turned on and off using the browser.
You can select any options in browser or in the modeling window to update their properties.
Events
It is recommended that a simple event be added, such as
Kinematics and Compliance (KnC) Analysis, and then the model be simulated as soon as it
is built. Events create motions and forces in the model which make the system move. Most
events add additional parts to the model to perform the simulation. The following steps
outline how to add an event to the previously built model.
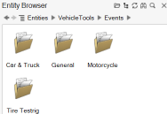
Click the Events icon under the Modeling ribbon, to access the Events folder in the Entity
Browser.
Figure 4.
Go to the General folder and double-click on the
KnC icon . The event
will be added to the model.
Figure 5.
Note: The KnC event adds an actuator Jack at each wheel and exercises the wheels
with motion and forces to perform Ride Analysis, Roll Analysis, Steering
Analysis, Lateral forces and Aligning moments. To learn more, refer to the
Front Suspension Analysis Tasks topic.
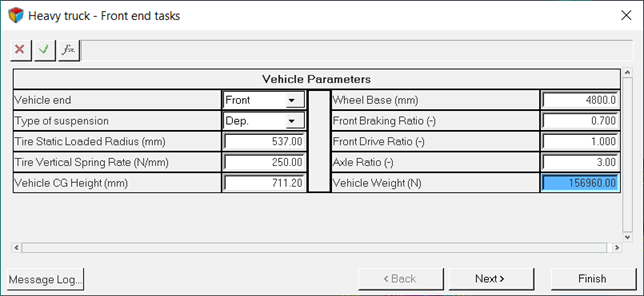
Select the event (KnC_0) in the Model Browser. Its properties will be shown in the Entity Editor.
Edit the vehicle parameters under the Vehicle parameters
section.
Figure 6.
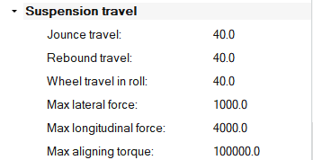
Edit the distance the wheels will travel during the event in jounce and rebound
under the Suspension travel section.
Figure 7.
The event is now ready to run.
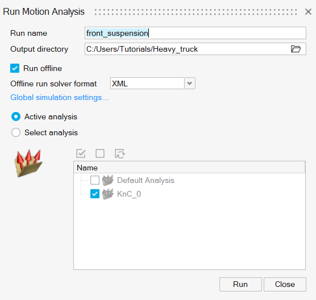
In the Solutions ribbon, click the Analysis settings
dialog satellite icon on the Run icon to open the Run Motion Analysis
dialog.
Figure 8.
Provide a Run name and an Output
directory.
Click the Run button.
MotionSolve is invoked and it displays the
solver window with progress as it runs.
After MotionSolve is completed, close the window
and return to the MotionView interface.
Reports
Report templates are a series of pre-defined standard sets
of plots and/or animation for an event. Reports are a powerful tool for generating
engineering information and can be easily customized. The vehicle library events have
pre-defined report templates that help generate the required plots and animation with a
few clicks.
To view reports:
Click Reports ribbon icon
under the Solutions group.
The View Reports Wizard opens.
Select the MSolve Standard Report Model option from the View
Reports window and click OK.
Figure 9.
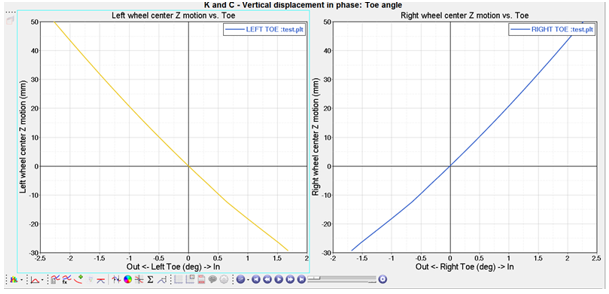
A series of pages with plots (37 plots and an animation page at the end) are
added to the session. Use the page navigation icon at the top right corner
to navigate pages and review the plots. Figure 10.

 under the Modeling ribbon, to access the Events folder in the Entity
Browser.
under the Modeling ribbon, to access the Events folder in the Entity
Browser.
 . The event
will be added to the model.
. The event
will be added to the model.
 The event is now ready to run.
 on the Run icon to open the Run Motion Analysis
dialog.
on the Run icon to open the Run Motion Analysis
dialog.
 under the Solutions group.
The View Reports Wizard opens.
under the Solutions group.
The View Reports Wizard opens.