Since version 2026, Flux 3D and Flux PEEC are no longer available.
Please use SimLab to create a new 3D project or to import an existing Flux 3D project.
Please use SimLab to create a new PEEC project (not possible to import an existing Flux PEEC project).
/!\ Documentation updates are in progress – some mentions of 3D may still appear.
2D curve: editing / display of values
Access to the calculated values
The calculated values can be:
- interactively visualized, point by point in the display zone (in cursor mode)
- visualized as a table (list of values) in the tab Values in the manager zone
Displaying the values
To display the values in a point (in cursor mode):
- move the pointer of the mouse on the desired graph and read directly the values displayed on the graph
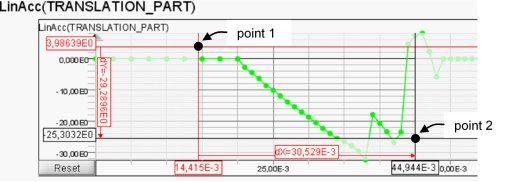
Displaying the difference between 2 points
To display the difference between two points (in cursor mode):
| Step | Action |
|---|---|
| 0 | Activate the cursor mode |
| 1 | Point on the graph to define point 1 |
| 2 | Click to set point 1 |
| 3 | Move the cursor to the desired point 2 (bridge 2 mobile) |
| → | The dX and dY values appear along the axes |
Display the calculated values list
To display the calculated values list:
- in the administration zone, open the Values tab
The user can retrieve the table of values by clicking on the icon ![]() (copied in the temporary
memory)
(copied in the temporary
memory)
- select the desired 2D curve
- activate the Export command ... from the contextual menu
Edit the particular quantities
The particular quantities (min. values, max. values, average values, ...) are not accessible in the environment of the 2D sheet.
This information is accessible from the data tree. See 2D Curve: editing (particular quantities)