Since version 2026, Flux 3D and Flux PEEC are no longer available.
Please use SimLab to create a new 3D project or to import an existing Flux 3D project.
Please use SimLab to create a new PEEC project (not possible to import an existing Flux PEEC project).
/!\ Documentation updates are in progress – some mentions of 3D may still appear.
2D curve: environment (2D curve sheet)
Environment of a 2D curve
A 2D curve has got its own environment. The illustration below permits to identify each of the zones of the 2D curve sheet.
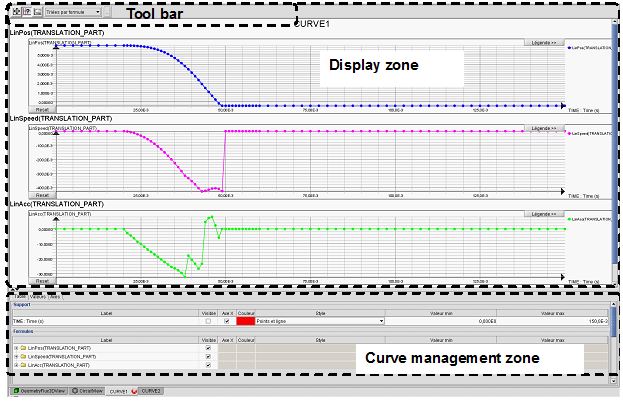
Zone of curve administration
The curves administration zone is subdivided into three tabs. The functions presented in each of the tabs are given in the table below.
| Proposition name | Tab | Function |
|---|---|---|
| (Representation / Properties / control panel/ Quantities) | Table |
|
| Table of values/ List of calculated values / ... | Values |
|
| Axes (scales) | Axes |
|
Display zone
The display zone is the zone reserved to the various graphs of the elementary curves.
Tool bar
The tool bar proposes the following tools:
- For value display (cursors)
- For framing (zoom, translation)
- For superposition of the elementary curves