
histogramcv
Computes the histogram of the red, green and blue colors of an image.
Syntax
R = histogramcv(handle, bins, dims)
[R, R1] = histogramcv(handle, bins, 1)
Inputs
- handle
- Handle of an image.
- bins
- Number of bins in the histogram, the value must be a positive integer.
- dims
- Dimension of the histogram. Valid values are 1 or 2. A value of 1 will generate a 1D histogram and a value of 2 will generate A 2D histogram.
Outputs
- R
- Handle of the histogram image.
- R1
- Handle of the histogram image with axes information. This is valid only for 1-dimensional histograms.
Examples
Generate a 1D histogram for the input image: Figure 1. Source image
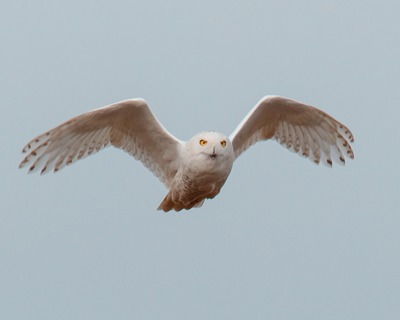
Figure 2. Histogram of source image
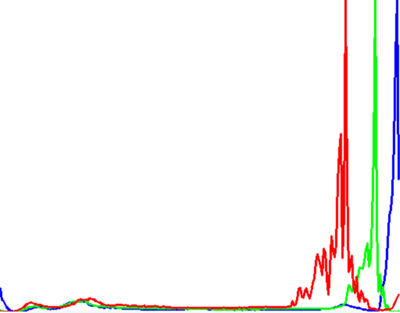
handle = imreadcv('image1.jpg');
bins = 256;
dims = 1;
R = histogramcv(handle, bins, dims);
plothandle = imshowcv(R);Generate 1D histograms with axes information: Figure 3. Source image
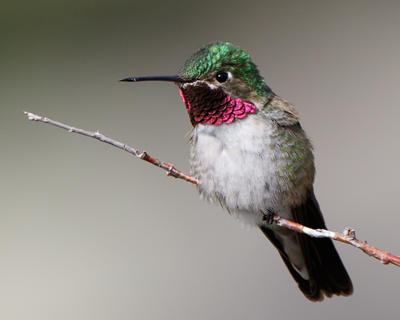
Figure 4. Histogram of source image with axes information
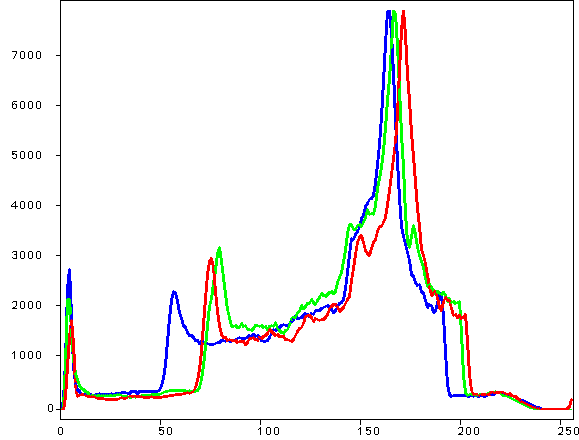
handle = imreadcv('image1.jpg');
bins = 256;
[R, R1] = histogramcv(handle, bins, 1);
plothandle = imshowcv(R1);