Create a Plot Template from Files Tab
Create a plot template, a customized shortcut to view plot results.
-
Click Files located in the top left-corner of the page.
All your model and job files are displayed.
-
Right-click a plot file and then click .
Figure 1. Plot TOC Menu 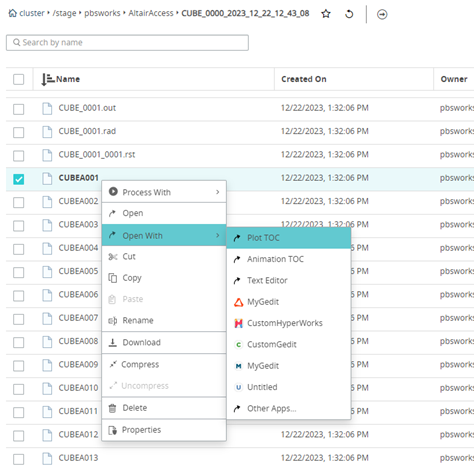
The Table of Contents (TOC) is displayed. - Optional: Enter a name for Plot Title.
- Optional: Enter a name for X-Axis Title.
- Optional: Enter a name for Y-Axis Title.
- Enter a name for the Template Name.
- Optional:
Click Subcase and select the required load case.
Note: By default, the first entry in the subcase list is considered for a plot.
- Optional:
Click Simulation to select a simulation query.
Figure 2. Plot Simulation Query Menu 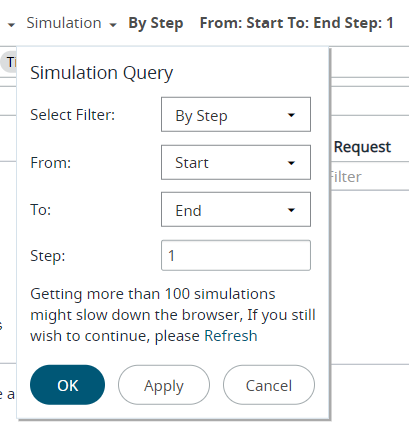
- Click OK.
-
For X-Axis parameters, to choose different parameters click
 located to the right of the field.
Note: By default, the first entry in the result parameters list is considered for a plot.
located to the right of the field.
Note: By default, the first entry in the result parameters list is considered for a plot. -
Select the required parameters for Y-Axis from the Result
Type, Request and
Component sections.
Figure 3. Select Plot Parameters 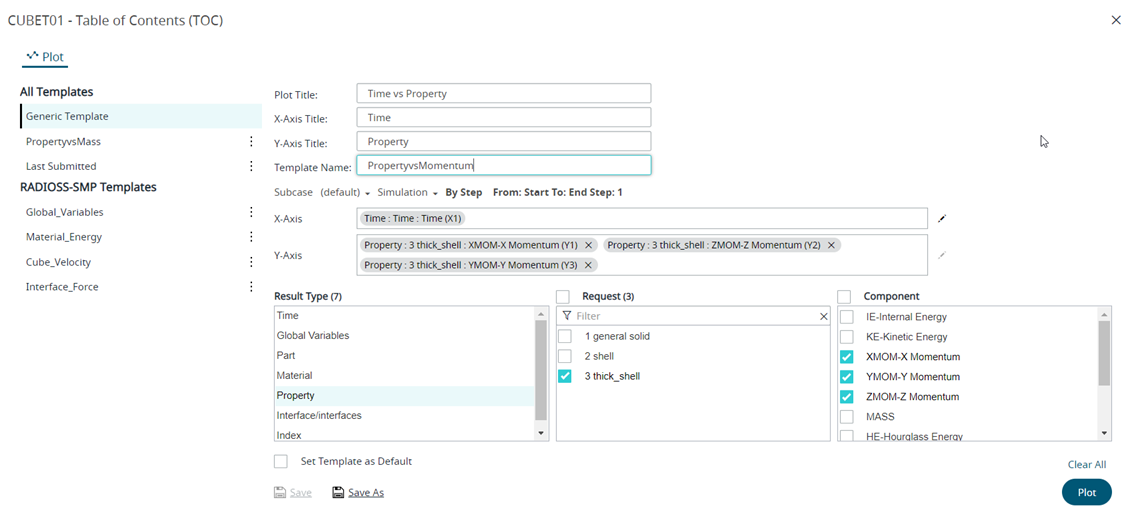 The selected components are added as X-axis and Y-axis variables.Note: Click
 to clear the Y-axis selections.
-
Click Save As to save the plot template.
In this example, The plot template: PropertyVsMomentum is categorized under All Templates since the plot result file is accessed from the Files tab and the result file doesn't have any solver information.The new plot template is displayed in the left pane.
Figure 4. New Plot Template 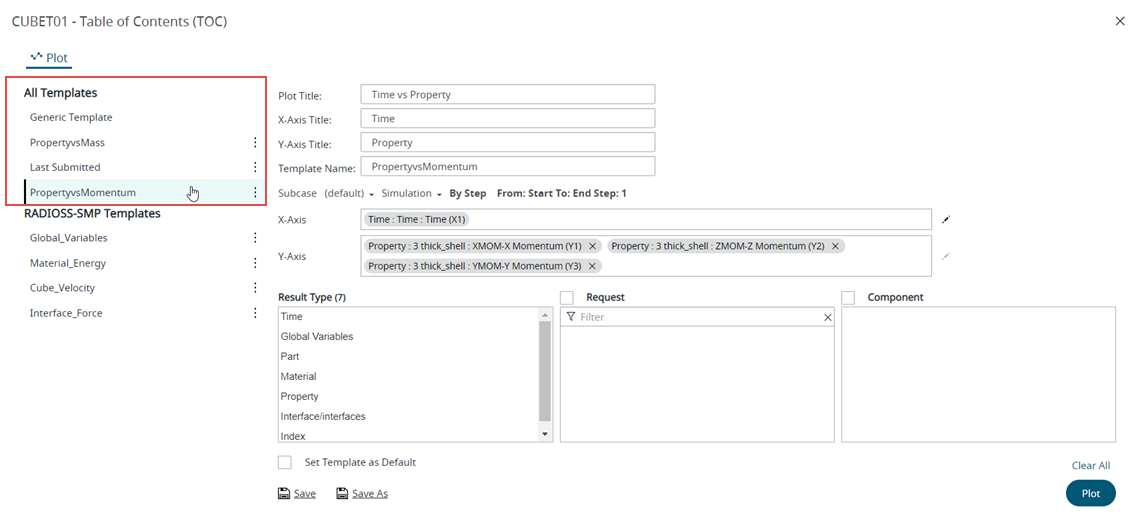
- Optional:
Choose one of the following:
- Click Set Template as Default check box to set the template as a
default template. Note: If a default template is set for a result file then RVS will display the plot result directly. If the set default template doesn't match the result file, the plot TOC is displayed with a message to select another valid template.
- Click Save to update the plot template.
- Click Set Template as Default check box to set the template as a
default template.