Create a Plot from the Job Output Tab
You can create and visualize plots from the result files of a completed job.
The job result files that are saved in Job ID folder are stored under the Files tab in the same location where the input files are placed. Hence, the results files are available from both the tabs for visualization.
-
Click Jobs located in the top left-corner of the
page.
Your jobs are displayed.
-
Select a completed job.
The plot result files of a completed job are listed under the Output tab.
-
Right-click a plot result file and then click .
Figure 1. Plot TOC Menu 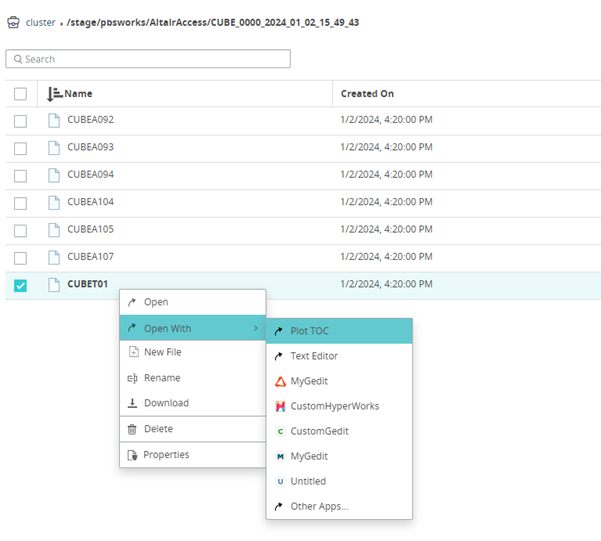
The Table of Contents (TOC) is displayed.Figure 2. Table of Contents for a Plot 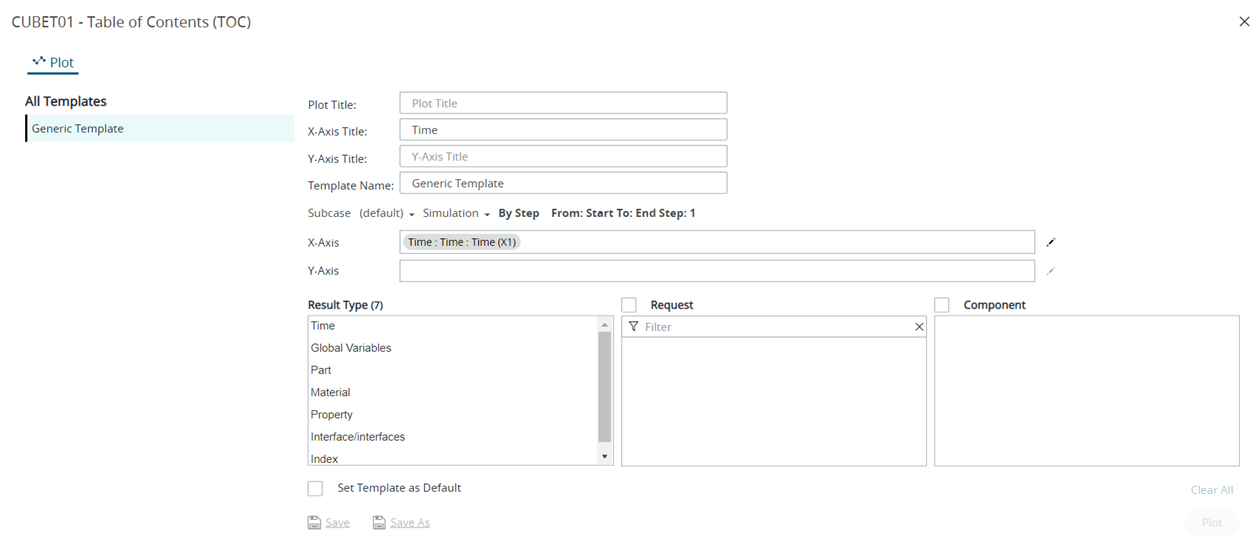
- Optional: Enter a name for Plot Title.
- Optional: Enter a name for X-Axis Title.
- Optional: Enter a name for Y-Axis Title.
- Optional:
Enter a name for Template Name.
The first time you create a plot, the default values are displayed in the TOC. If you change any parameters, click Generic Template to reset their values.
- Optional:
Click Subcase and select the required load case.
Note: By default, the first entry in the subcase list is considered for a plot.
- Optional:
Click Simulation to select a simulation query.
Figure 3. Plot Simulation Query Menu 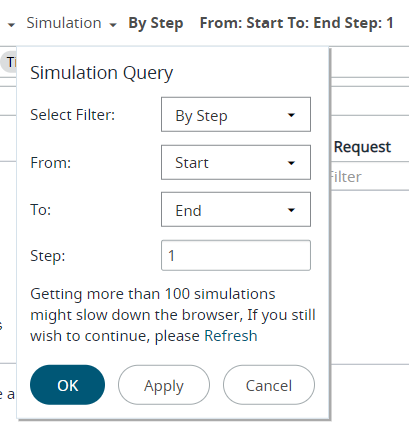
- Click OK.
-
For X-Axis parameters, to choose different parameters click
 located to the right of the field.
Note: By default, the first entry in the result parameters list is considered for a plot.
located to the right of the field.
Note: By default, the first entry in the result parameters list is considered for a plot. -
For Y-Axis, select the required parameters from the Result
Type, Request and
Component sections.
Figure 4. Select Plot Parameters 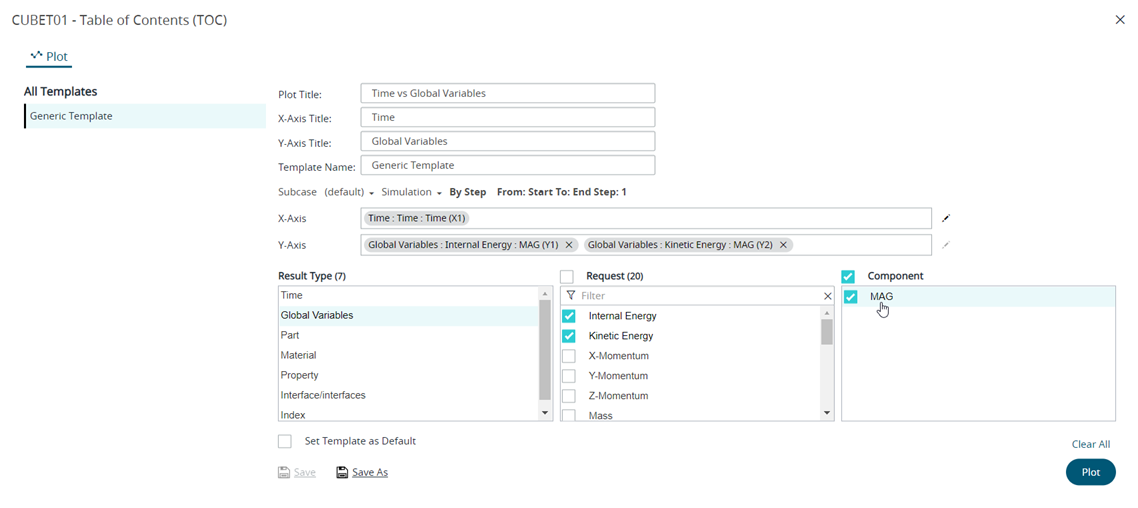 The selected components are added as X-axis and Y-axis variables.Tip: Click
 to clear the Y-axis selections.
- Optional: Click Set Template as Default check box to set this template as a default template. The next time you open result files of the same format, the template will be applied and the plot will be automatically generated.
-
Click Plot.
The plot result is displayed for the selected parameters. The Last Submitted template is updated with the selected parameters and is also displayed in the Template drop-down list as shown here:
Figure 5. Plot Result 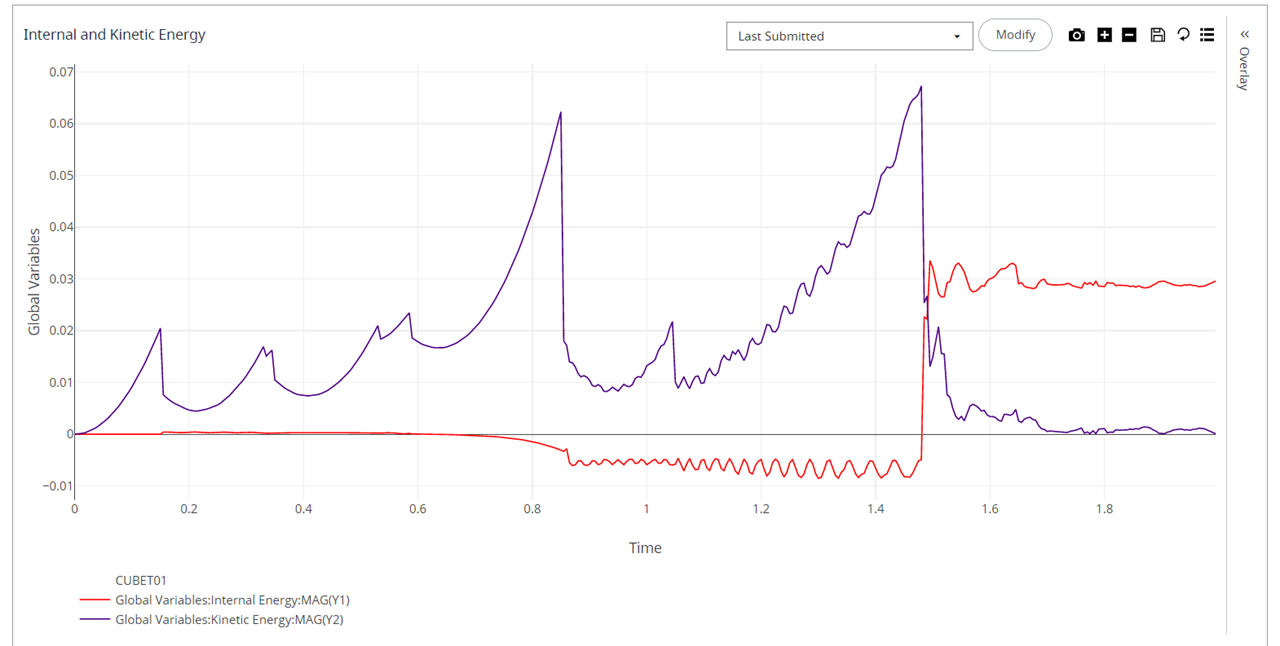
Tip: Click to return to the plot TOC to modify the plot
parameters.
to return to the plot TOC to modify the plot
parameters.