Thermal Runaway
![]()
Introduction
Thermal runaway in battery packs is a major safety concern with potentially catastrophic outcomes, such as battery pack fires. This phenomenon occurs in batteries due to exothermic degradation reactions when a battery is subjected to abusive conditions, such as physical damage, internal short circuits, overcharging, or overheating. These conditions, along with the associated decomposition of battery components (e.g., anode, cathode, and separator), lead to significant heat release and an uncontrollable rise in temperature. When a single cell enters these thermally unstable conditions, the heat release can cause adjacent cells to heat up and enter thermal runaway, eventually propagating through and consuming the entire battery pack. Additionally, the decomposition reactions generate flammable gases that can ignite, causing fires to spread through the battery pack.
- NREL Abuse Model
- ARC Reaction Model
- Heat Rate Model
The first two models are chemical kinetic models based on the Arrhenius equation. The NREL model takes a mechanistic approach to model the kinetics and heat release of individual cell components, while the arc reaction heat model adopts a more phenomenological approach, deriving the reaction kinetics directly from ARC data. The heat rate model also uses ARC data but directly reads this data to determine the volumetric heat source.
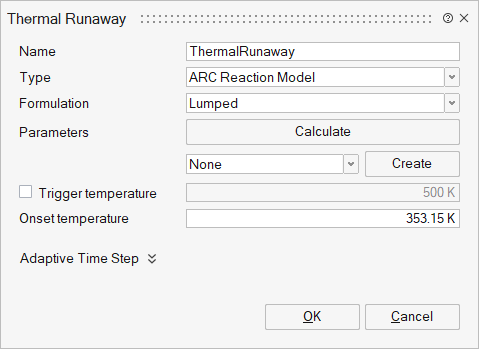
ARC Reaction Model
Accelerating Rate Calorimetry (ARC) is a widely used method for assessing the abuse kinetics of lithium-ion batteries. The data gathered from ARC enables the determination of decomposition kinetic parameters for the governing Arrhenius equations of thermal runaway. During the ARC test, a battery is placed inside a calorimeter under adiabatic conditions, with thermocouples attached to measure temperature. The test initiates in a heat-wait-seek mode, where a heater heats the calorimeter incrementally, then pauses to allow thermal transients to decay and equilibrium conditions to be reached. If any increase in temperature-rate surpasses a preset threshold value (indicating exothermic reactions), the calorimeter switches to exotherm mode. In this mode, the calorimeter tracks the temperature rise and maintains zero temperature differential between the cell surface and the calorimeter walls, ensuring adiabatic conditions. The final phase involves either full thermal runaway and subsequent cooling or simply cooling if the temperature rate falls below the preset threshold value. From the ARC test, a typical temperature profile is obtained, as shown in the image below.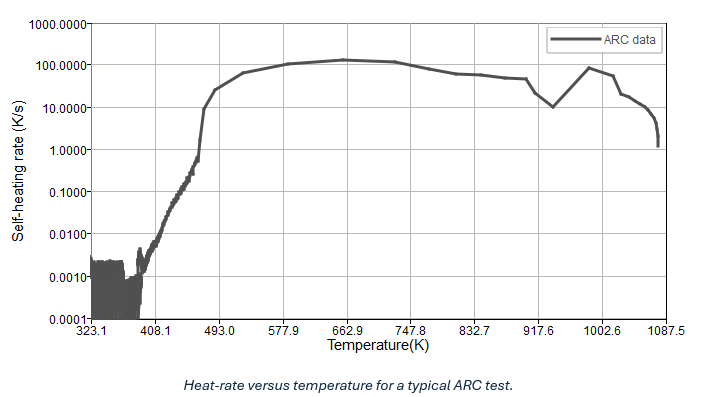
The ARC reaction model thermal runaway panel provides a platform to input the Arrhenius chemical kinetic parameters and reaction enthalpy to predict chemical heat generation under abuse scenarios calibrated against ARC data.
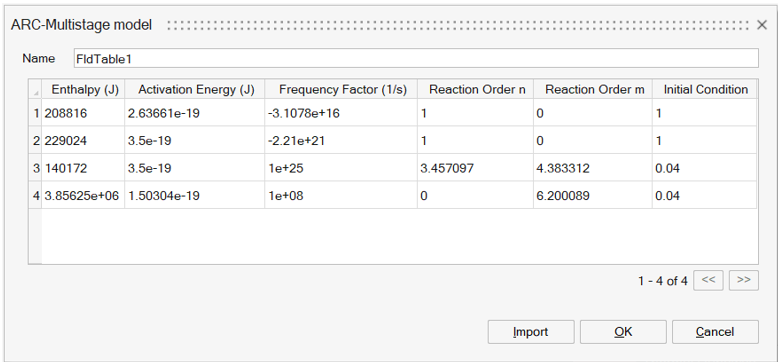
- Parameters: Specifies the parameters for the multi-stage fit of ARC data. This is an N x 6 array containing the following values for each reaction stage (up to five stages): Enthalpy (J); Activation energy (J); Frequency factor (1/s); Reaction order n (-); Reaction order m (-); Initial condition (-). Each row represents a specific reaction stage. The Calculate button launches an ARC data parameter fitting tool. This tool fits the above six parameters for each stage to the provided ARC data.
- Trigger Temperature: The temperature at which thermal runaway is initiated, as recorded during the ARC experiment. At or above this temperature, the ARC data is sub-stepped in time for improved accuracy.
- Onset Temperature: The self-heating onset temperature for thermal runaway, as recorded during the ARC experiment. At or above this temperature, the ARC data model is activated.
- Enable SEI Decomposition model: Specifies the SEI decomposition parameters. This is a single row, six-column array of Enthalpy (J); Activation energy (J); Frequency factor (1/s); Reaction order n (-); Reaction order m (-); Initial condition (-).
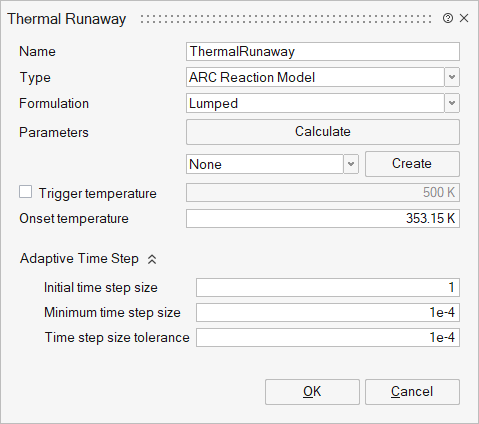
- Advanced Settings:
- Initial Time Step Size: The initial time step for sub-stepping the reaction kinetic equations.
- Minimum Time Step Size: The smallest allowable time step for sub-stepping the reaction kinetic equations.
- Time Step Size Tolerance: Controls the sensitivity of time step adjustments in response to changes in the solution. A smaller tolerance value results in finer sub-stepping of the thermal runaway ODE.
Fitting ARC data
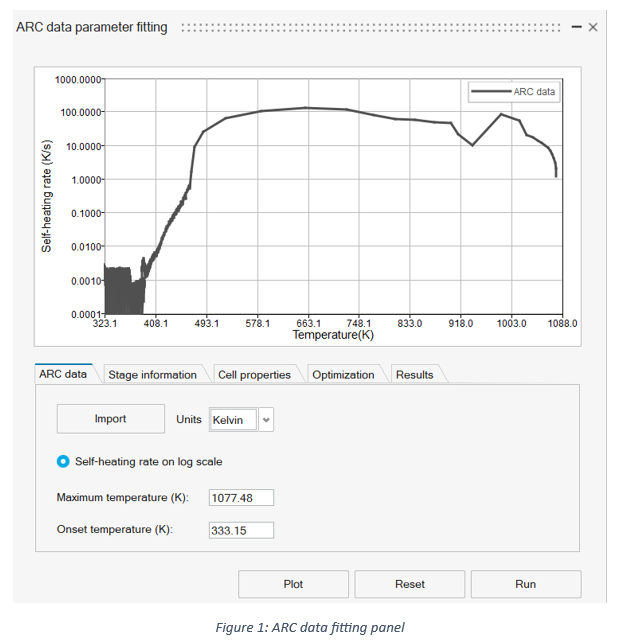
The Calculate button opens a panel (see Figure 1) for fitting the Arrhenius and reaction enthalpy parameters without laborious linearization methods. A summary of the tabs and the required input is shown below:
Arc data tab
- Import: Import ARC data in the format: time, temperature, and self-heating rate (K/s)
- Units: Temperature units of import ARC data
- Self-heating rate on a log scale: Enable/disable the temperature axis on a log scale
- Maximum temperature (K): Automatically displays the maximum temperature
- Lower temperature limit (K): Limits the lower temperature of the data
Stage information
The stage information panel allows users to define the number of stages and specify the initiation temperature for each stage (see below for a detailed description). The input options are shown in Figure 2.
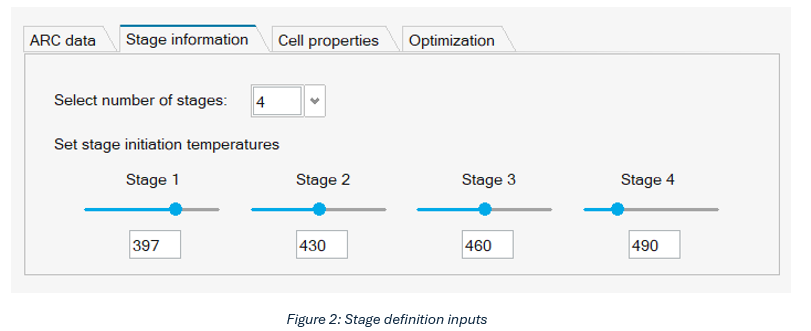
- Select number of stages: Defines the number of stages into which the ARC data will be divided. SimLab supports up to four divisions.
- Set stage initiation temperatures: Defines the initial temperature for each stage. Values can be entered manually or adjusted using the sliders, which will automatically update the graphics window.
Although an ARC test does not identify the decomposition of individual reacting components, it can still be represented by Arrhenius kinetics with physical meaning depending on the number of stages used to represent the data. For example, two stages may group together SEI and anode decomposition into the first reaction kinetic, and cathode conversion and electrolyte decomposition into the second reaction kinetic. The exact grouping, however, depends on the specific cell chemistry.
Alternatively, a four-stage model could be motivated from both physical and observed features of the data where: Stage 1 likely corresponds to the reaction between intercalated lithium in the anode and the electrolyte; Stage 2 could represent the initial decomposition of the positive electrode, such as partial decomposition. Stage 3 primarily captures the sudden rise in the self-heating rate (observational), and Stage 4 may correspond to the rapid decomposition of the positive electrode and oxygen release, leading to a significant temperature jump.
Ultimately, establishing a link to decomposition processes requires intricate knowledge of reactions occurring in a specific cell. However, top-down fitting procedures utilizing staged Arrhenius kinetics alleviate the need to associate reaction kinetics to individual components.
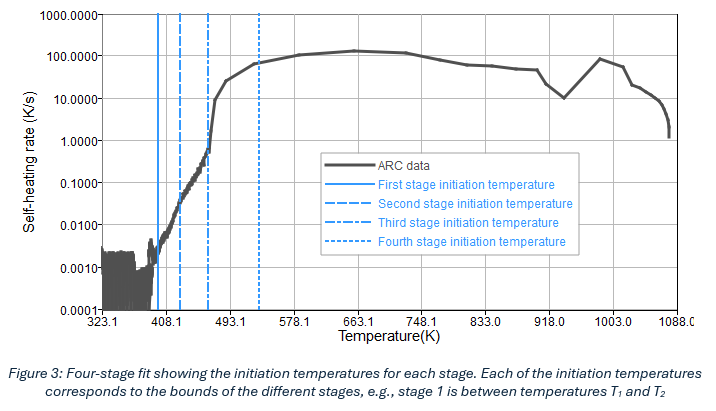
The fitting for the ARC data follows a sequential process in which the dataset is divided into N stages, where N is a user-defined input. Figure 3 illustrates an example of dividing the ARC data into four stages based on stage initiation temperatures, where T1, T2, T3, and T4 represent the start temperature of each stage, respectively. The actual stages are defined as: Stage 1: T2-T1; Stage 2: T3-T2; Stage 3: T4-T3; Stage 4: Tmax-T4. Tmax is the maximum temperature recorded from the ARC test as is determined automatically from the data.
- Region 1: When self-heating starts, the heat rate is log-linear w.r.t temperature
- Region 2: Sudden increase in heat rate
- Region 3: Continued high heat rate until the thermal runaway subsides due to complete consumption of reactants
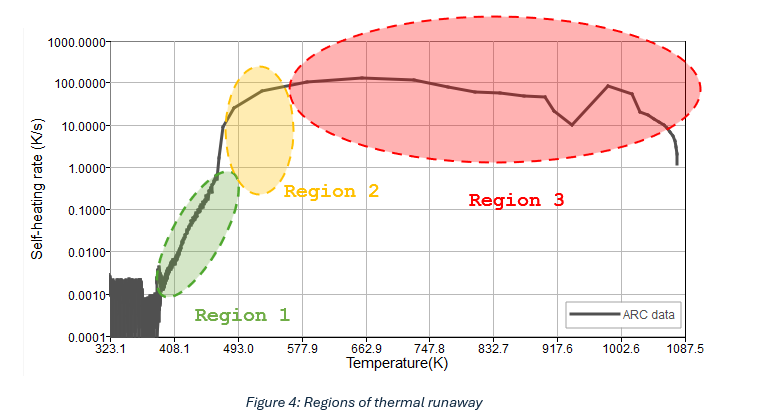
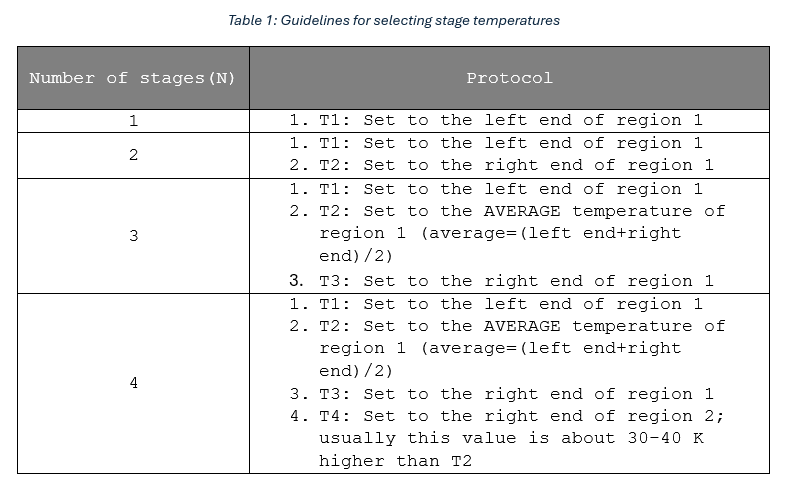
The choice of N determines how each of these regions is modelled using one or multiple Arrhenius reaction equations. Based on existing literature and our experiments, the guidelines shown in Table 1 may be followed for commonly used values of N (T1, T2, T3 and T4 are as defined before):
Cell Properties
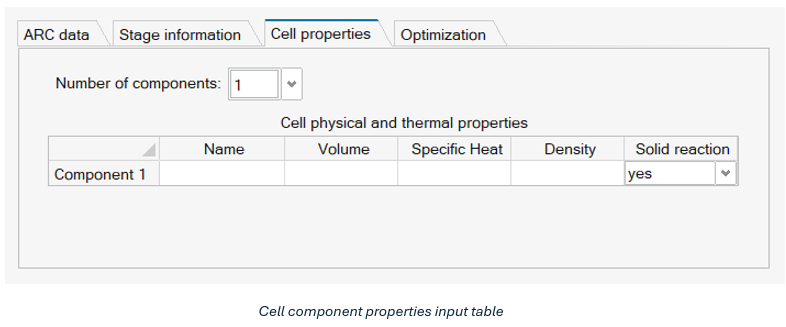
The cell properties tab, shown in Figure 5, provides the input structure for defining the different components of the cell under consideration.
- Number of components: Specifies up to five physical regions of the cell
- Name: Name of the component
- Volume: Volume of the component in m3
- Specific heat: Specific heat capacity of the component in J/kgK
- Density: Density of the component in kg/m3
- Solid Reaction: A yes/no option indicating whether the component has exothermic reactions occurring. At least one component must be set to ‘yes’.
Providing a detailed description of the cell improves the accuracy of the thermal runaway model calibration against ARC data, ultimately improving the model’s predictions for other experiments, such as 3D ARC tests, oven tests, and propagation tests.
Typically, a cell can be divided into a rough division of its physical components (e.g., steel can, jelly roll, tabs, etc., as shown in the image below and the corresponding physical properties of each component.
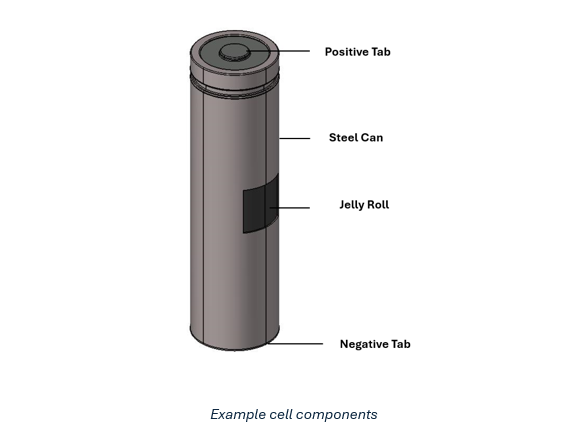
For the above-mentioned reasons, it is beneficial to gather detailed information on the division and characteristics of each component within the cell. However, if this information is unavailable, the cell can be approximated as a single component, typically the jelly roll. Furthermore, if the exact volume and densities of a component are not known, the user may approximate by setting volume=1 unit and density=mass of the component.
Optimization
The fitting process for each stage uses a swarm search algorithm, where the position of each particle represents a specific parameter set. The governing ordinary differential equations (ODEs) are integrated over time, generating predictions for the heat rate versus temperature (dT/dt vs. T) and temperature versus time (T vs. t). These predictions are then compared to the ARC data up to the end temperature for that stage.
A loss function is formulated and incorporated into the optimization algorithm to evaluate the fit. The process iterates to determine the optimal parameters for each stage and continues iteratively across all stages.
The optimization parameters can usually be left at their default values, but if modification is required are input through the optimization panel as referred below.
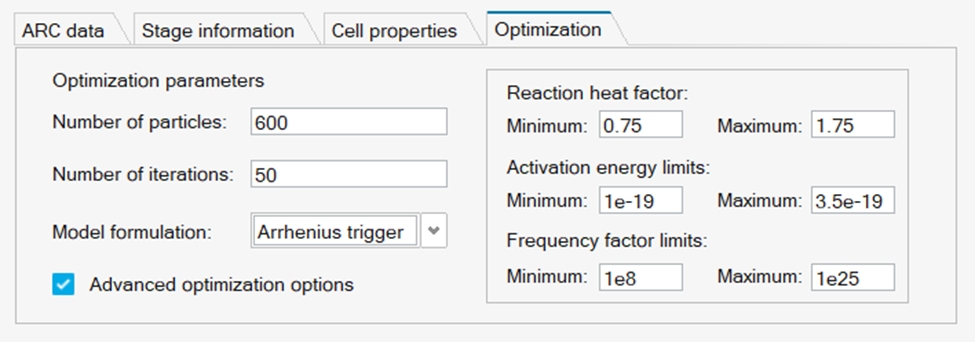
- Number of Particles: Number of particles used in the search; increasing makes the fitting more accurate, but slower
- Number of Iterations: Number of search iterations; increasing makes the fitting more accurate but slower
- Model Formulation: If set to “Arrhenius Trigger”, the last stage heat is only added after its initiation temperature. This is found to be a better way to fit the ARC data. Leaving as default is advised.
- Reaction heat factor: Defines a search space for the enthalpy value. If the fitting consistently fails to achieve the maximum temperature of the experimental ARC data, the upper limit may be increased to ~2.
- Activation energy limits: Defines a search range for the activation energy. In most cases, this should not require a change, but if the maximum temperature achieved in the ARC experiment is very high, the upper limit of this may be increased by up to ~50%
- Frequency factor limits: Defines a search space for the frequency factor. Users should not need to change this.
Output
The output for the multi-stage model is given as an array of stages and Arrhenius kinetic/material parameters. These are automatically loaded back into SimLab.
NREL Abuse Model
The mathematical model for thermal abuse involves heat generation resulting from a series of exothermic decomposition reactions of various battery components. The heat generation from these individual reactions is aggregated and incorporated into the energy equation as a combined source term.
The source term is derived from decomposition reactions occurring in the battery, which are characterized using Arrhenius equations, accounting for: 1) Solid electrolyte interface(SEI) decomposition at the anode-electrolyte interface (〖~80-100 〗^o C); 2) Anode decomposition (intercalated lithium reacting with electrolyte, facilitated by SEI decomposition); 3) Cathode conversion (active material decomposition releasing oxygen), which is highly exothermic; and 4) Electrolyte decomposition at very high temperatures. Additionally, short circuit events can also be included, e.g., separator melting leading to direct connection between the anode and cathode. The short circuit leads to charge depletion and is given as a function of state of charge (SOC). The final source term is applied to the energy equation through nodal temperature updates based on the solution of the governing Arrhenius ODEs.
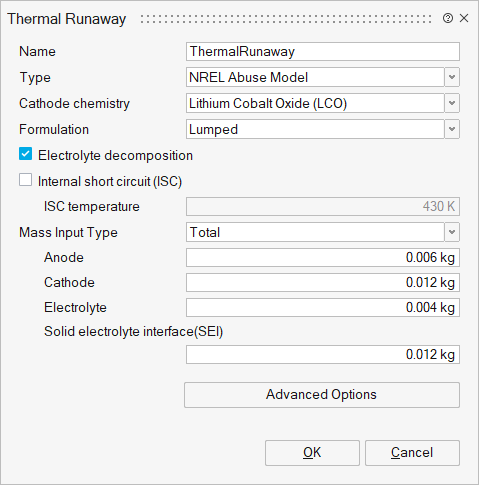
- Cathode chemistry: Specifies the types of lithium-ion batteries. Here we provide parameters for three sets of cathode chemistry: LCO, NMC and LFP. Additional cathode chemistry can be applied by editing the Advanced Options panel.
- Formulation: Method to apply heat contribution for thermal runaway
- Lumped: Thermal runaway heat contribution is modelled as a lumped parameter for the entire battery cell.
- Nodal: Thermal runaway heat contribution is calculated at each node within the battery cell.
- Maximum: Thermal runaway heat contribution is determined based on the maximum temperature within the battery cell.
- Electrolyte decomposition: Specifies Hatchard-type thermal runaway heat generation model, incorporating additional heat generation from electrolyte decomposition.
- Internal short circuit (ISC): Enable or disable the Internal short circuit equation.
- ISC temperature: Temperature at which an internal short circuit occurs.
- Mass Input Type: Defines the type of mass input: total mass or volume specific. For volume-specific, it refers to the mass of the anode (or cathode, electrolyte, etc) divided by the jellyroll volume.
- Anode Mass: Mass of the anode material in the battery core.
- Cathode Mass: Mass of the cathode material in the battery core.
- Electrolyte Mass: Mass of the electrolyte material in the battery core.
- Solid electrolyte interphase (SEI) Mass: Mass of SEI in battery core.
Heat Rate Model
Direct reading of self-heating rate (or temperature rate) as a function of temperature from ARC or other sources is supported when the type is set to Heat Rate Model. This method applies the heat-source directly to the energy equation.
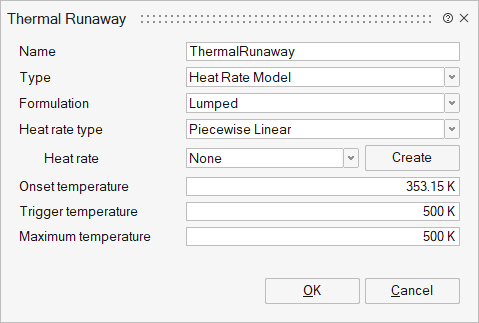
- Heat rate type: Type of ARC experimental data fitting.
- Piecewise Linear - Piecewise linear curve fit of ARC experimental data
- o Cubic Spline - Cubic spline curve fit of ARC experimental
data
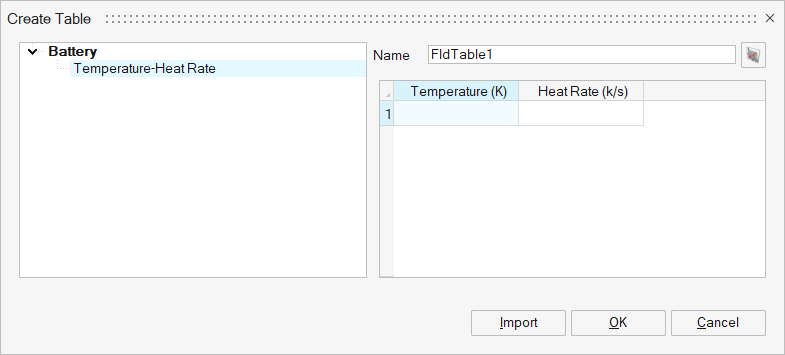
The data from this method is read or created via a table. The format of the input ARC data is a comma-separated file of temperature and self-heating rate.
- Trigger Temperature: The temperature at which thermal runaway is initiated, as recorded during the ARC experiment. At or above this temperature, the ARC data is sub-stepped in time for improved accuracy.
- Onset Temperature: The self-heating onset temperature for thermal runaway, as recorded during the ARC experiment. At or above this temperature, the ARC data model is activated.
- Maximum temperature: Maximum cell temperature recorded during the ARC experiment. Automatically determined from the maximum temperature in the temperature-Heat Rate table.