Instrument Panel
The Instrumental Panel tool facilitates the post-processing of the FMVSS201 and ECE-R21 analysis.
This tool uses time-history and result files as input and automates the post-processing with minimal input, therefore reducing the report generation lead time.
In HyperView or HyperGraph, from the tool group, click the Instrument Panel tool to invoke the IP Impact Post dialog.
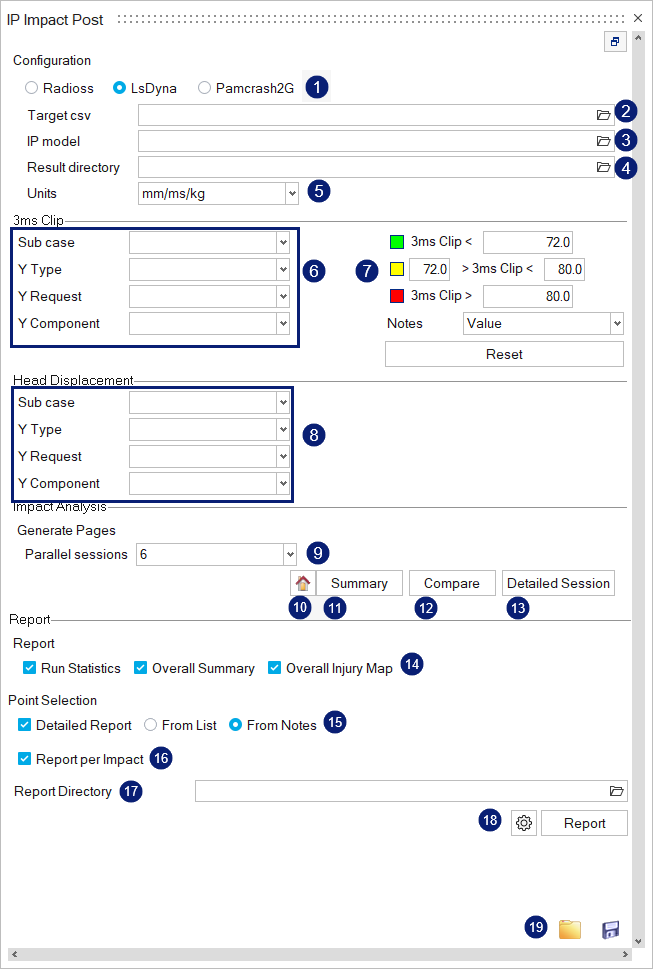
- Configuration (Solver Selection)
Supported solvers are Radioss, LS-DYNA, and PAM-CRASH 2G.
- Target csvSelect the HyperMesh-created *.csv file.Note: Upon using HyperMesh to mark and position the impactor, HyperMesh generates a CSV file
- IP model
Select the solver input file that contains the Instrumental Panel model.
- Result directory
Select the root directory that contains the analysis directories as sub-directories.
- Units
Select the model units from the drop-down menu.
- 3ms Clip
Select the acceleration data from the output file for the 3ms clip curve.
Select the sub case, Y Type, Y Request, and Y Component.
- Threshold/Limit Values and Color SelectionDefine the limit values and colors.
- Click the color palette to select the color.
- Define the limit/threshold values in the value field.
- Select the 3ms clip value or the impact location name for summary.
- Use Reset to restore the default values and colors.
- Head Displacement
Select the displacement data from the output file for the displacement versus time curve.
Select the sub case, Y Type, Y Request, and Y Component.
- Parallel sessions
Select the number of batch processes to launch. For example, if processing 200 impact locations, the number of parallel processes are launched to reduce processing time.
- Home button
Click to return to the summary page.
- SummarySelect the impact locations to post-process in the summary page:
Figure 3. 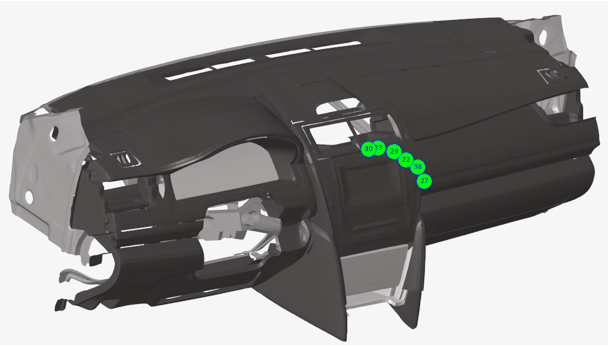
- CompareClick Compare to select the impact locations to be processed using the Select compare options:
- Select folder to compare: From the file browser, select multiple analysis folders to be compared.
- Select notes to compare: Select multiple notes on the summary window to be compared.
- Detailed SessionClick Detailed Session to select the impact locations to be processed through the Select target points window. For each selected target point, a page is generated with the following results:
Figure 4. 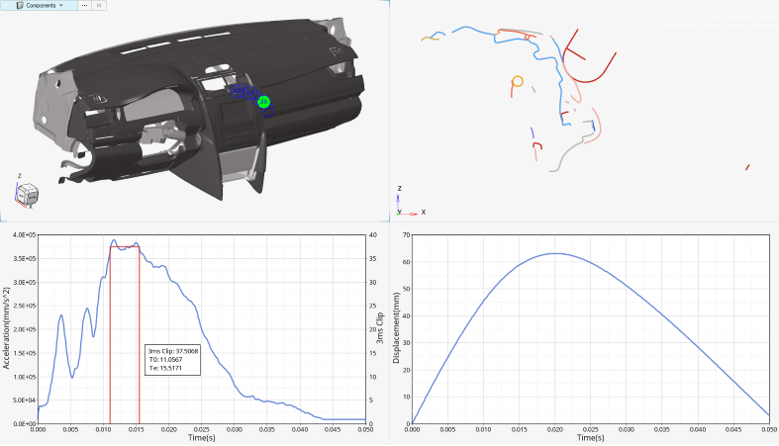
- ReportRun Statistics: Run a summary of the Normal versus Error termination per impact location:
Figure 5. 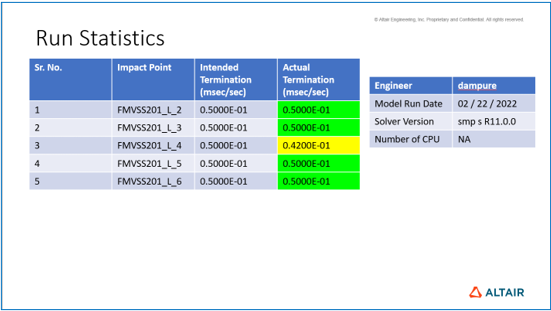
Overall Summary: Summary table of the 3ms clip value and maximum displacement for all selected impact locations.Figure 6. 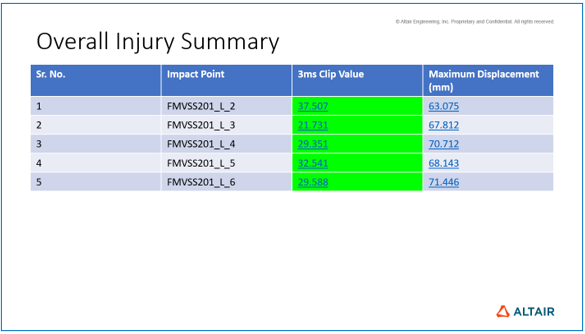
Overall Injury Map: 3ms map on the Instrumental Panel.Figure 7. 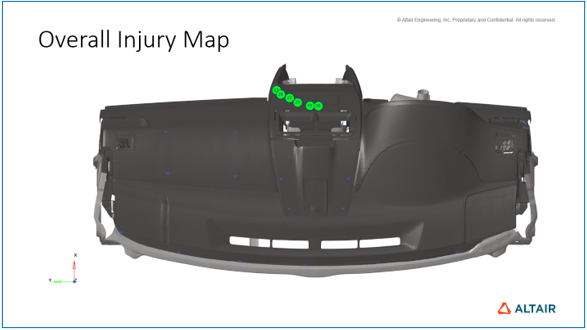
- Point Selection
From List: Select the impact points from the list to create the detailed report for.
From Notes: Select the impact points from the modeling window by selecting the notes to create the detailed report for.
- Report per ImpactA detailed slide for all selected impact points is created in the report.
Figure 8. 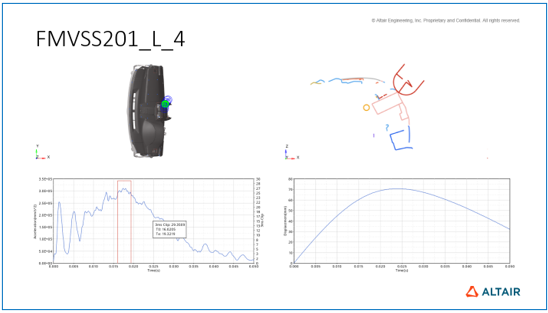
- Report Directory
The report directory where the consolidated report PowerPoint file is saved.
- Report
Click Report to generate the final PowerPoint file. The Setting icon opens the report settings.
- File Browser Folder and Save
Save or import a configuration file containing all defined setups.