Tutorial 11: MultiCase Tutorial
Purpose/Objective
This exercise will walk the user through setting up a multicase run. The user will learn how to:
- Use Flow Simulator Multicase creator
Step 1: Objective
- The user will start with the existing water piping model and set up a multicase run to investigate the effects on flow caused by changes in pressure of an upstream chamber
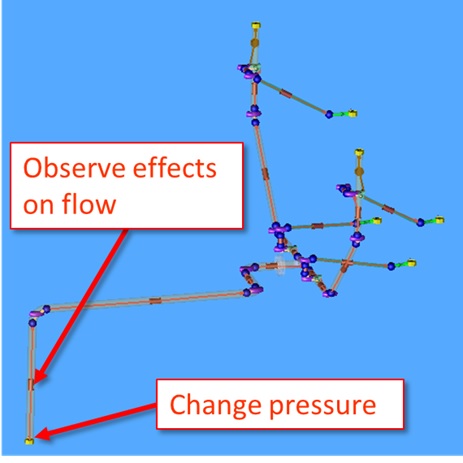
Figure 1.01: Chamber and element of focus
Step 2: Load existing model
- Browse to model location and select open (Water_piping.flo)

Figure 1.02: Loading existing model
Step 3: Building Model
- Go to Probabilistic & DOE → Multicase Creator
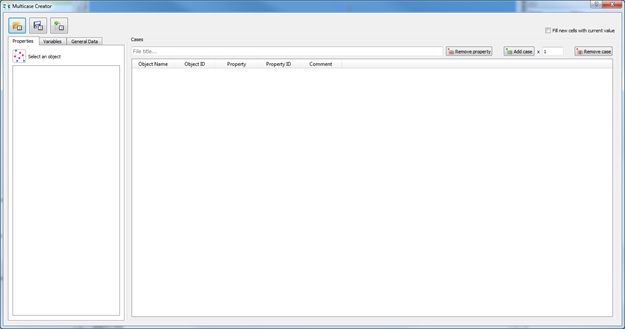
Figure 1.03: Multicase menu
- Click the inlet boundary plenum (this will populate the Properties tab)
- Select Static Pressure from the list
- In the box next to the Add case button, enter 11 and click the Add case
button
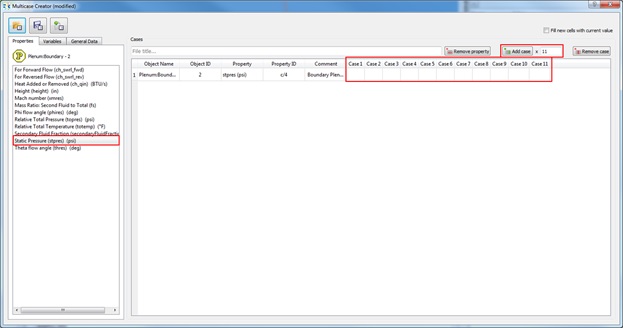
Figure 1.04: Setting up Multicase inputs
- In the box next to the Add case button, enter 11 and click the Add case
button
- The range of inlet pressures for this plenum will be from 20 psi to 30 psi. Fill in
the empty case boxes with pressures start from 20 psi and increasing in increments
of 1 psi
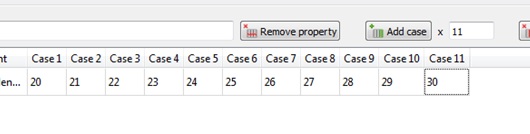
Figure 1.05: Inlet pressure inputs
- Save
 the multicase file and close the
multicase creator
the multicase file and close the
multicase creator - In the solution Panel, select Multiple Cases and click Multi-case Settings
- Under Multi-case Import file, click browse and select the multicase file
created earlier and click OK
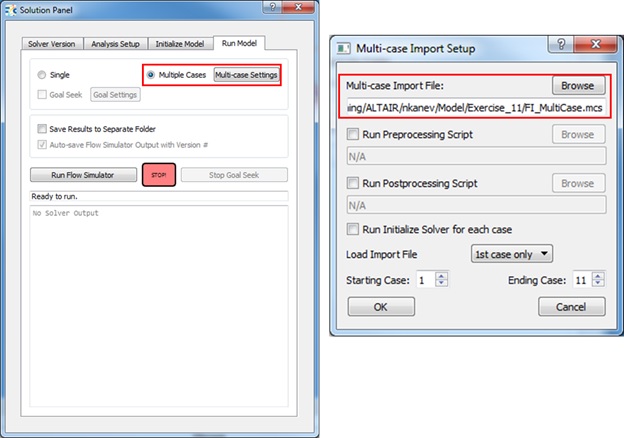
Figure 1.06: Set up to run multicase
- Under Multi-case Import file, click browse and select the multicase file
created earlier and click OK
- In the solution Panel, Initialize Model, accept values, and Run Flow Simulator
Step 4: Post Process Model
- Go to PostProcessing → Results Table
- Under Results, click
 , select the Chambers radial
button and enter the Inlet Chamber ID
, select the Chambers radial
button and enter the Inlet Chamber ID - Select Append and go to the Inputs tab
- Choose Static Pressure
- Select and choose the element downstream of the
inlet chamber
- Select Append and go to the Results tab
- Choose Total Flow
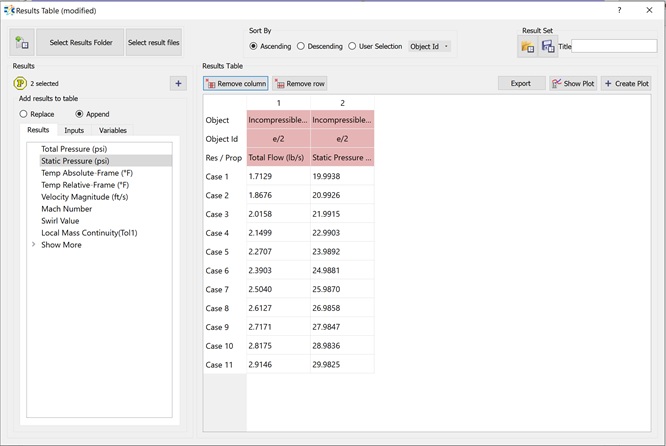
Figure 1.07: Results Table showing pressure and flow
- Choose Total Flow
- Highlighting two columns and clicking show plot will create a line a plot of both
values and also a “Scatter Plot” button. Clicking that button will create a plot
seen in Figure 1.08
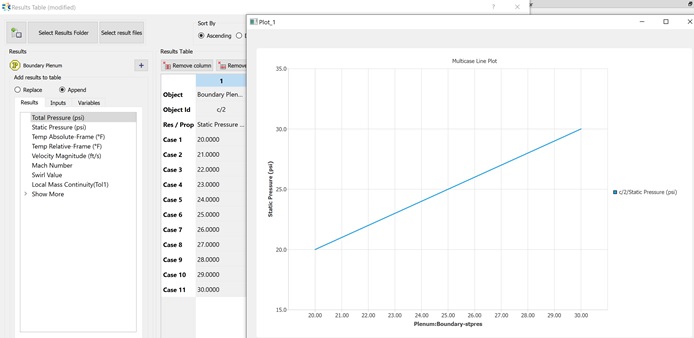
Figure 1.08: Scatter plot of static pressure vs flow rate
- Figure 1.08 shows the impact on flow rate as a result of changing inlet pressure of the system