Use the Domain Grid
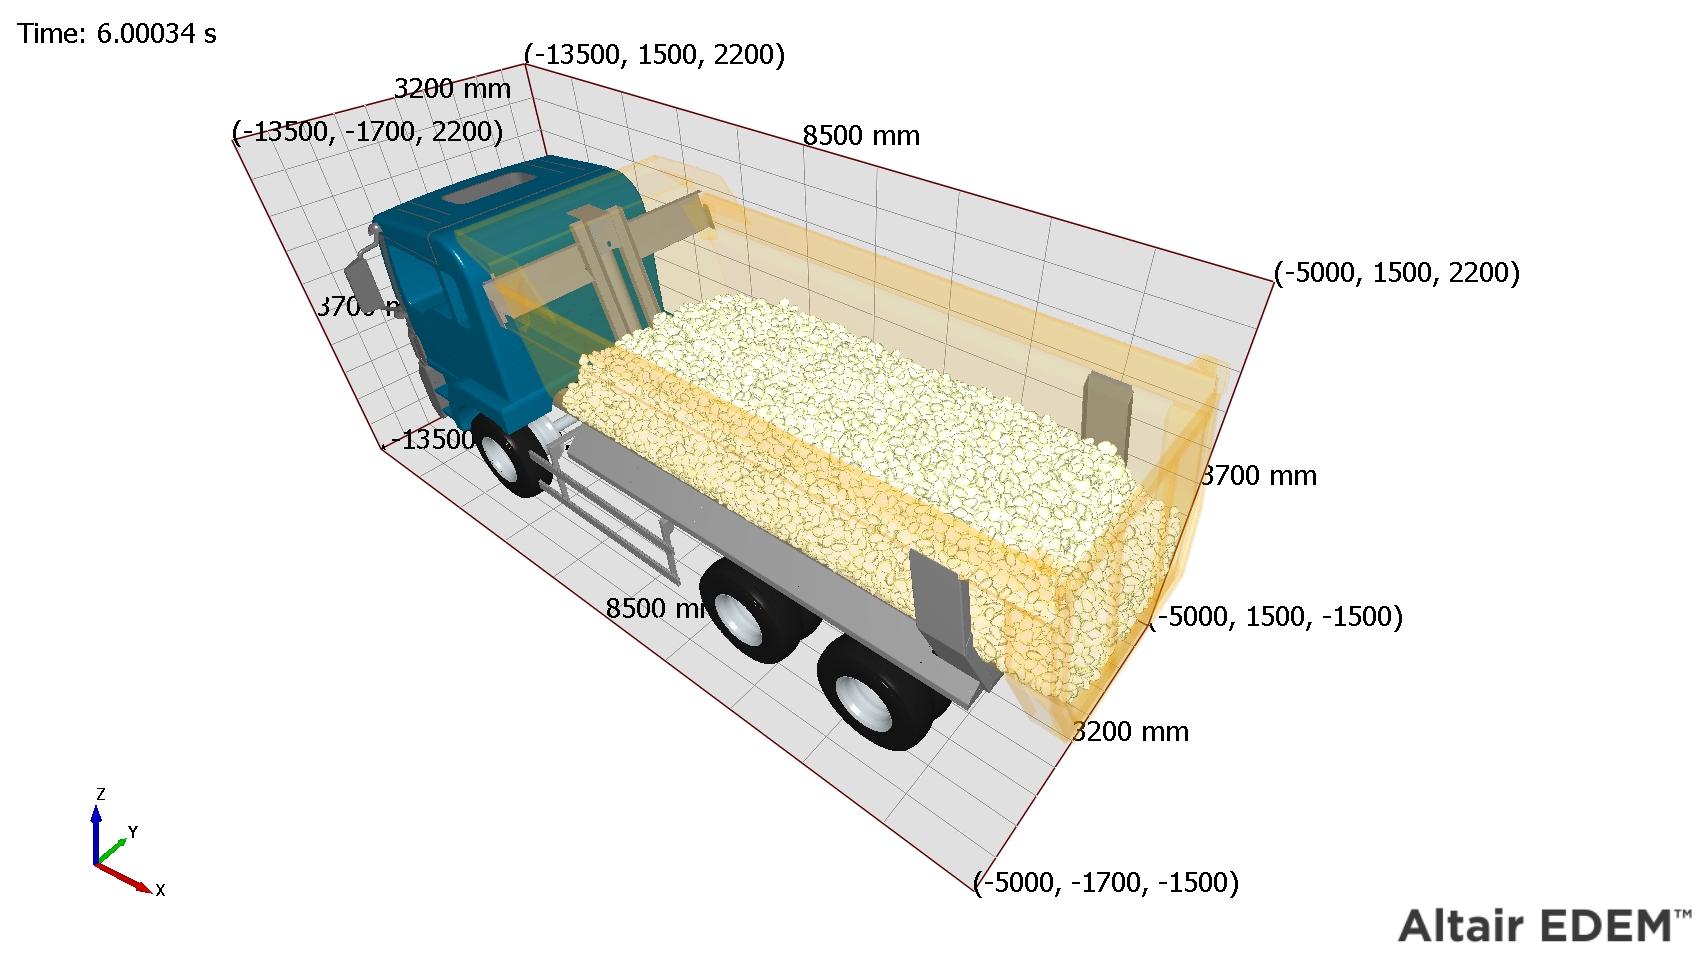
The Domain Grid is a visual aid used to indicate the scale of your model.
A grid can be added to each side of the domain (+X, +Y, +Z, -X, -Y and -Z). The number of intervals in each grid is also specified. The coordinates of each vertex and the length of each edge are shown.
- From the Tools Section, click Domain Grid.
- Select the Gridlines checkboxes to add a grid to each side of the domain (+X, +Y, +Z, -X, -Y and -Z).
-
Specify the number of intervals in each grid.
The coordinates of each vertex and the length of each edge are displayed in the following model with 10 interval, +X, -X, and +Y grids:
