EDEM Simulator is a powerful solver used for fast and
efficient simulations.
Use EDEM Simulator to:
Configure and control the EDEM simulation engine,
and observe the progress of your simulation
Cutting-edge DEM solver, highly parallelized for use on multi-core shared memory
workstations, GPU hardware, and Multi-GPU systems
Double-precision Solver engine used for CPU where as Double, Hybrid, or single
precision can be used for GPU platforms
Simulations for large and complex particle systems
Live viewer window to review progress and assess design performance
Ability to start and stop simulations at any time or configure data output while
running a simulation
EDEM Simulator is supported by a range of time-saving tools,
including the novel Dynamic Domain as well as auto-settings for key DEM solver
parameters that help reduce the overall simulation run time.
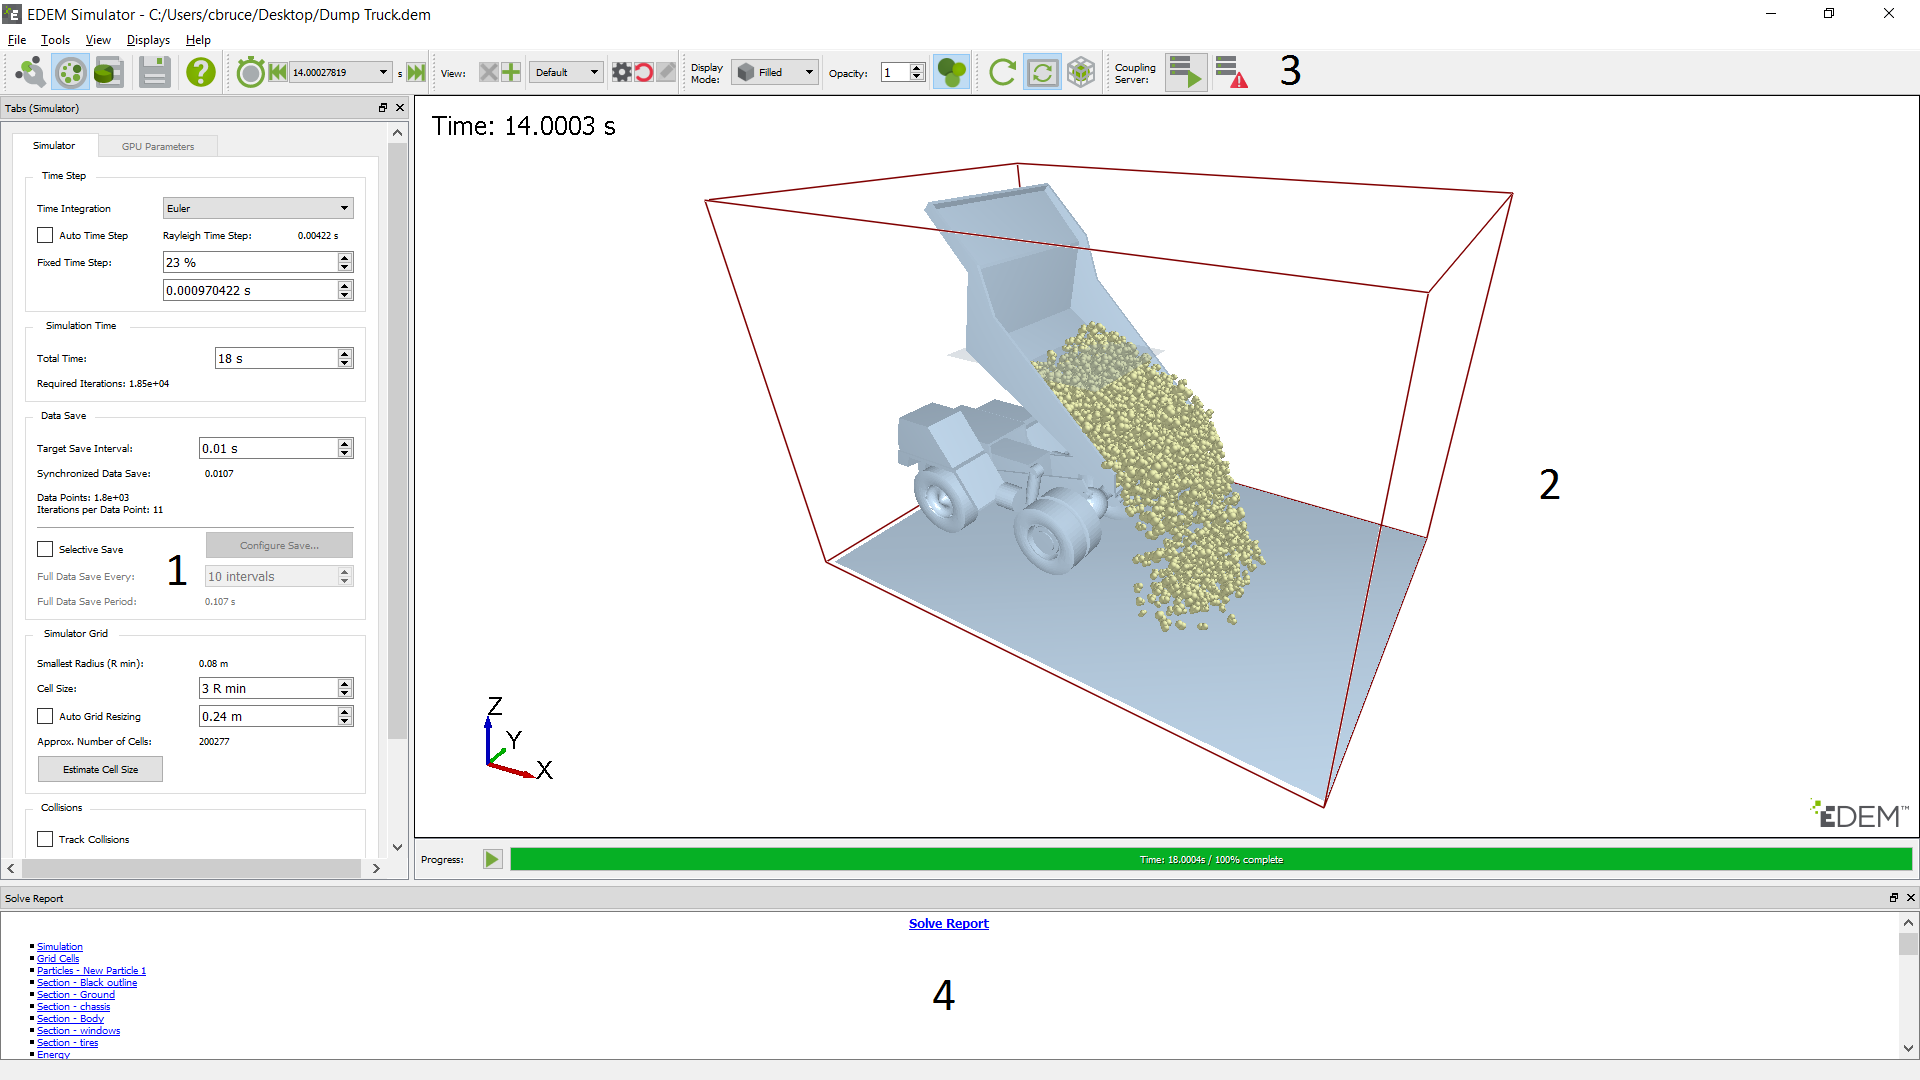
The Simulator Pane
The Viewer
The Toolbar and Menu Bar
The Solve Report
The Simulator Pane
The Simulator pane is where you define the Time Step, simulation time, grid options
and Simulator Engine for the CPU mode.
The Viewer
The Viewer displays 3D representations of your particles, Geometry, and fields (if
applicable). You can control the rotation, position, and zoom factor of the Viewer
using a mouse. There are a number of animation controls displayed below the
Viewer.
You can set up more than one display by splitting the screen in order to see the
progress of the simulation from different points of view. The simulation start/stop
button and simulation progress bar are located below the Viewer.
The Toolbar and Menu Bar
Icon
Name
Description
Creator
Opens EDEM Creator
Simulator
Opens EDEM Simulator
Analyst
Opens EDEM Analyst
Save
Saves changes made to the Simulator settings
Help
Displays the online Help
Change Time Step Back
Moves to the first Time Step in the simulation
Change Time Step Forward
Moves to the last Time Step in the simulation
Filled Display Mode
Displays Geometry as filled
Mesh Display Mode
Displays Geometry as a mesh
Points Display Mode
Displays Geometry as points
Display Particles
Displays or hides all particles
Display Frozen Particles
When selected while using the Dynamic Domain, any frozen
particles will be colored black
Display Cylindrical Periodic Boundary Conditions
Displays cylindrical periodic boundary conditions
Show GPU Splitting Plane
Shows/hides GPU splitting planes
Refresh Display
Updates Viewer to display the 3D simulation at the Time Step when
the button is pressed
Note: For more information about how to configure and set options,
click Tools > Options..., and see Set Options.
Solve Report
The Solve Report is an .html page that displays detailed information
about your model. It provides detailed information from the last refresh point which
may not be the current simulation time.
In the Simulator tab, right-click the tool bar, and click Solve
Report to launch the Solve Report in case it is disabled.
You can move and position the Solve Report below the 3D Viewer, above the
Simulator settings, or in place of the Simulator Settings where you can
navigate back and forth between the Solve Report and Simulator
settings.
Right-click the Solve Report and select Save to save
the information in an .html file.
Right-click the Solve Report and select Refresh to
update the information to the current simulation time.
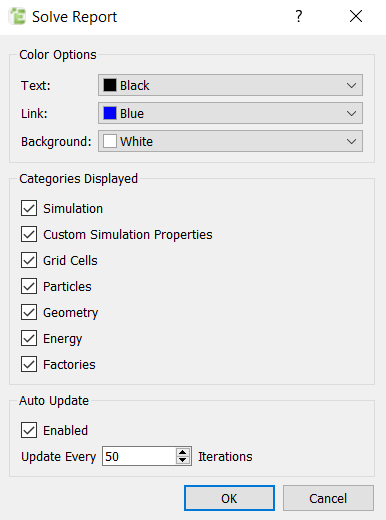
Tools > Options
Color
Options
Text
Changes the color of the text used in the Solve
Report
Link
Changes the color of the hyperlinks used in the Solve
Report
Background
Changes the background color of the Solve Report
Categories
Displayed
Simulation
Shows statistics related to the entire simulation in the
Solve Report
Custom Simulation Properties
Shows details of the Custom Properties in the Solve
Report
Grid Cells
Shows details of the cell grid size (only if you have
selected the CUDA Solver) in the Solve Report
Particles
Shows details related to particles in the Solve
Report
Geometry
Shows details related to Geometry in the Solve Report
Energy
Shows statistics related to energy in the Solve
Report
Factories
Shows statistics related the factories in the Solve
Report
Volume Packing
Shows statistics related to volume packing in the Solve
Report
Auto
Update
Enabled
Updates the Solve Report at regular intervals
Update Every <n> Iterations
Modifies the number of intervals used to update the Solve
Report
The Solve Report contains the following sections:
Simulation
Status
Indicates whether the simulation is processing or
stopped
Time Step
Indicates the time step used by the model as detailed in the
Simulator
Estimated total computation time
Indicates the estimated total time to complete the
simulation
Current time
Indicates the time elapsed into processing
Elapsed computation time
Indicates the time since the simulation started (excluding
pauses)
Exported simulations
Indicates the elapsed time reset to 0 on export
Particles
Total number
Indicates the total number of particles in the model
Total removed
Indicates the total number of particles removed from the model.
For example, particles that move beyond the domain
boundaries.
Minimum speed
Indicates the speed of the slowest particle in the model
Maximum speed
Indicates the speed of the fastest particle in the model
Grid Cells (CUDA Solver)
Status
Indicates the allocation of grid cells or if grid cells have been
initialized
Side Length
Indicates the dimensions of grid cells as specified in the
Simulator
Created
Indicates the number of grid cells created
Geometry Section
Speed
Indicates the speed of the Geometry section
Number of particles in contact
Indicates the total number of particles in contact with the
Geometry section at the current Time Step.
Energy
System energy
Indicates the total energy in the model at the current time. It
is the sum of the kinetic energy, potential energy and the energy in
any contacts taking place. It should be equal to the total energy
gained by creating particles plus the total energy gained by
Geometry movement minus the energy lost through contacts minus the
energy lost by removing particles.
Kinetic and potential energy
Indicates the total kinetic and potential energy in the
system
Total lost by removing particles
Indicates the total energy lost by removing particles from the
domain
Total lost through contacts
Indicates the total energy lost by contacts between
elements
Total gained by creating particles
Indicates the total energy gained
Total gained by external forces
Indicates the total energy gained from external forces.
Factory
Status
Indicates the current factory status
Total particles created
Indicates the number of particles that could not be placed after
reaching the maximum attempts to place the particle
Total particles regenerated
Indicates the number of particle creation attempts. If this
number is significantly larger than the total particles created, it
is an indication that the simulation is running slowly due to
excessive CPU effort going towards creating particles.
Total particles failed
Indicates the number of particles accepted and currently being
generated
Total particles accepted
Indicates the number of particles accepted in the grid
Creation rate/target creation rate
Indicates the particle or mass creation rate as specified in the
Factories pane
Mass created since rate change
Indicates the amount of mass created by the factory (when the
creation rate is set to the target mass rate of particles).
Actual creation rate since rate change
Indicates the actual creation rate (as opposed to the target
creation rate) when the creation rate is set to the target mass rate
of particles
View Menu
Show Particles
Select to turn the particle display on or off in the
Viewer
Parent-Child Lines
Select to view the lines connecting objects in the Creator
and Simulator tabs that are linked with parent–child
relationships
Themes
Select Legacy (default) or
Dark Theme for the EDEM interface
Toggle Display Command Line Output
Select to open the Command Line output window and view items
that are not displayed in the EDEM
interface, such as licensing errors.
Show Frozen Particles
Select to view the frozen particles in black when using
Dynamic Domain
Refresh Display
Select to update the Viewer to display the 3D simulation at
the Time Step when the button is pressed
Auto Update
Select to activate/deactivate automatic updates to the
simulation in the Viewer
Show Simulator Grid
Select to activate/deactivate the Simulator Grid
Displays Menu
Show 1 Display
Shows the EDEM window in a single
display.
Show 2 Displays
Shows the EDEM window in two viewer
displays to review different view-points of the model within each
window
Show 3 Displays
Shows the EDEM window in three viewer
displays to review different view-points of the model within each
window
Show 4 Displays
Shows the EDEM window in four viewer
displays to review different view-points of the model within each
window
Split Display Horizontally
Splits the displays horizontally so that simulations may be
simultaneously reviewed qualitatively and quantitatively on the same
display
Split Display Vertically
Splits the displays vertically so that simulations may be
reviewed both qualitatively and quantitatively on the same
display
Help Menu
Help
Displays information about the EDEM interface
About EDEM
Displays the current version of EDEM. The EDEM Version and Revision number are useful for EDEM Technical Support when discussing
support cases.
About Altair Simulation Products
Displays the Copyright notices, Altair website, License
Agreements, and Customer Support information.