Analyst Tree-Field
Analyst Tree-Field allows you to define the way fields are displayed.
Display and Analyze Field Data
- Select the display option from the Field dropdown
list.
This field shows the display options that can be applied to each field in your model.
- Select the Display field Name check box to enable or disable the display of the selected field.
- Select the Display Mode from the dropdown list and then specify the following details :
| For | Specify |
|---|---|
| Display Mode | |
| Point Display | Select to enable field points to be displayed. |
| Point Size | If Point Display is enabled, set the point size. The default size is 1 pixel. |
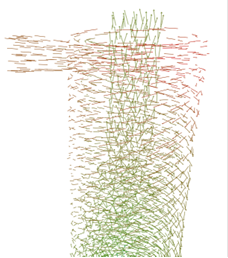
| Vector Display | Select to enable the field to be displayed as vectors. |
| Vector Line Length | If Vector Display is enabled, set the field line length. |
| Set 2D Field Position | Set the field’s position in the Z axis (or other axes, depending on the 2D field’s orientation set in the Field Data Manager). |
| Field Coloring | |
| Component | Select the component to color: Magnitude, X, Y, or Z. |
| Levels | Select the levels and value for the following colors:
|
| Coloring Legend | Select the following for the legend:
|
| Show Legend | Select the checkbox to display the legend. |
| Position Legend | Select the checkbox and then click anywhere in the Viewer to
position it. Assign a color for the minimum, median, and maximum values. Fields will be colored depending on the approximate range they fall in. The value range is determined by setting the minimum and maximum attribute values. You can enter the values directly or read from the model by clicking Update. This takes the current maximum and minimum values from the model. |
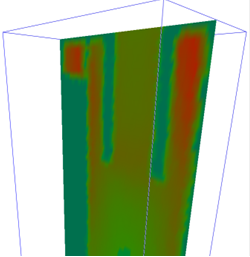
| Plane | |
| Plane Orientation | Select the plane’s orientation: X-Y, X-Z, or Y-Z. |
| Number of Points in X | Depending on the plane orientation, set the number of points in the X (or Y) direction from 2 to 999. Increasing the value increases the display resolution, but resampling will take longer. The default value is 100. |
| Number of Points in Y | Depending on the plane orientation, set the number of points in the Y (or Z) direction from 2 to 999. Increasing the value increases the display resolution, but resampling will take longer. The default value is 100. |
| Plane Position in Z | Depending on the plane orientation, adjust the position of the plane in the X, Y, or Z direction. The plane must remain within the plane’s bounding box. The default location is 0 mm. |
| Resampling Method | Select one of the following resampling methods:
|
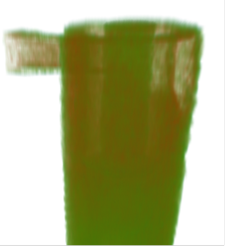
| Volume | |
| Number of Slices in X | Set the number of slices in the X direction from 1 to 100. Increasing the value increases the display resolution, but resampling will take longer. The default value is 10. |
| Number of Slices in Y | Set the number of slices in the Y direction from 1 to 100. Increasing the value increases the display resolution, but resampling will take longer. The default value is 10. |
| Number of Slices in Z | Set the number of slices in the Z direction from 1 to 100. Increasing the value increases the display resolution, but resampling will take longer. The default value is 10. |
| Field Coloring | |
| Component | Select the component to color: Magnitude, X, Y, or Z. |
| Coloring Legend | Select the following for the legend:
|
| Show Legend |
Select the Position Legend option then click anywhere in the Viewer to position it. The following options can be set: A color should also be assigned for the minimum, median, and maximum values. Fields will be colored depending on whereabouts in the range they fall. The value range is determined by setting the minimum and maximum attribute values. The values can be entered directly or can be read from the model by clicking Update. This takes the current maximum and minimum values from the model. |
| Hide Field | |
| Opacity | Select the opacity level from 0 (fully transparent) to 1 (opaque). |
| Enable Hide | Select to enable thresholds for field display. When enabled, set the values to hide if less than and/or more than a certain threshold. You can enter the values directly or read from the model by clicking Update. This takes the current maximum and minimum values from the model. |
Field Representation
The following table provides details about the Flow, Plane, Volume, Field Coloring, and so on.