Tavares UFRJ Breakage Model
The Tavares UFRJ Breakage contact model captures the various body breakage mechanisms that occur during particle collisions.
- Particle to Particle
- Particle to Geometry
- Particle Body Force
Body breakage
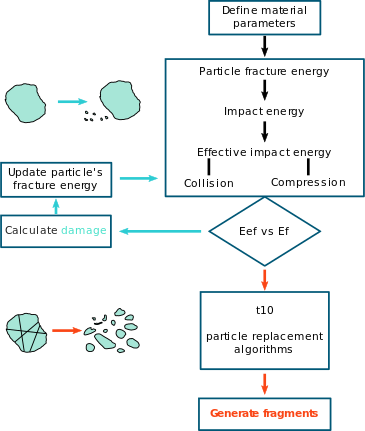
Calculation cycle
During comminution, particles of a given material suffer impacts with a magnitude lower than the level required to break. However, the repeatability of impacts can result in energies sufficient to cause internal crack-like damage on the particle, leading in its weakening and making it more amenable to break in a future stressing event. Therefore, subsequent impacts with energy smaller than the original particle fracture energy can lead to breakage. This effect is called Particle Damage Accumulation (Tavares 2002 and Tavares 2009).
After the material is set up with the use of relevant parameters, EDEM detects impacts and calculates the energy absorbed from each impact event. The recorded impact energy is assigned accurately to each element involved in the collision based on their stiffnesses and it is compared with the stored fracture energy of the particle. If the first value is smaller than the second value, the particle will not break but suffer damage that will subsequently create a new fracture energy to the particle, which will be lower than the previous one.
Furthermore, compared to a force or stress-based model, a model with an energy-based critical condition is less sensitive to the choice of either coefficient of restitution or stiffness values during the simulation. The stressing energy is given by the combination of the normal and shear energies, defined as:
Where En, Et are the normal and shear energies, respectively and ct is the fraction of the shear energy that contributes to the collision energy which may vary with the impact angle. Although the breakage probability and weakening were originally developed in the form of continuous distributions, being particle-based, they are directly amenable to be adapted to describe populations of discrete particles in DEM.
Particle Replacement Method (PRM)
The Particle Replacement Method employed in the model uses previously established research from the Federal University of Rio de Janeiro and also includes an innovative approach that has been developed in house with close collaboration with the Federal University of Rio de Janeiro and the University of Edinburgh.
The main condition for a particle to break and be replaced by its fragments requires the specific impact energy to be higher than the specific fracture energy of the particle. Unlike breakage probability, adapting the continuous breakage distribution model to a discrete one is a very challenging task, since the original breakage model was developed on the basis of average information on fragments distribution as well as on median values of fracture energies of particles.
The extent of breakage of the fragments is represented by a single parameter, t10, which reflects the proportion of fragments that are finer than 1/10th of the parent particle size (Napier-Munn 1996, Tavares 2008). You can find more details in Tavares and das Neves (2008), Saeidi et.al. (2016).
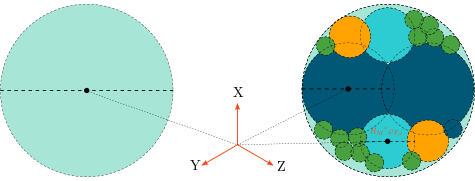
In order to resemble the outcome of a real breakage event, in which the fines are concentrated at the point of application of stresses, spheres inside the parent particle are arranged so that the largest fragments overlap in perpendicular direction to the stress that caused breakage. The remaining finer fragments are then arranged in the remaining voids, often overlapping with the coarser fragments.
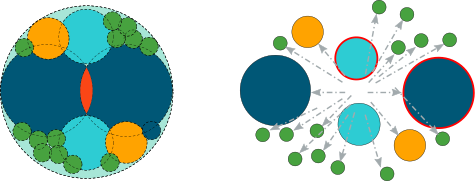
The fragments are originally allowed to overlap during replacement in order to fit inside the original mother particle volume. These huge overlaps between fragments can produce strong artificial repulsive forces between them. A sophisticated technique has been used here to prevent potential fragment explosions. A damping rule is used to limit the total contact force that can be applied to each fragment (global damping strength) as well as the amount of time that the reduced force can be applied (global damping time). Furthermore, based on Griffith’s theory (Sun and Jin 2012) the model also controls the reduction of the artificial overlap between fragments in order to account for the energy dissipation during internal fracturing.
In order to allow some of the fracture energy to be transferred back to the fragments, a portion of this overlap can be determined (referred to as the local damping strength). This method uses advanced principles of contact mechanics, allowing you to control the kinematics of the fragments and prevent the appearance of extremely high velocities of the fragments which would make simulations unrealistic. If any of the global parameters is zero, this damping step is not applied to the fragments.
Explanation of Parameters
Each particle has a specific fracture energy, which is assigned based on its size, mean value, and standard deviation. This energy will vary according to the upper-truncated lognormal distribution (Tavares 2002) defined as:
Where E is the particle fracture energy distribution corresponding to the maximum stressing energy that it can sustain in a collision, Emax is the upper truncation value of the distribution, and E50, σ are the median and standard deviation of the distribution, respectively. The median specific fracture energy of the particle is defined as:
Where E∞, do, and φ are model parameters that must be fitted to experimental data and dp is the representative particle size contained in the size class and kst is the stiffness of steel (230GPa). It should be noted that if the surface is a Geometry, then its elasticity must be close to the value of the real material used for the physical testing. If the particle elasticity is scaled, then the Geometry’s elasticity should be scaled accordingly, to maintain the ratio between the two.
| Material | d0 (mm) | E∞ (J/kg) | ϕ (-) | σE | γ | A (%) | b' | dmin (mm) | Emin (J) |
|---|---|---|---|---|---|---|---|---|---|
| Copper Ore | 400 | 60 | 0.45 | 0.4 | 5 | 67.7 | 0.029 | User defined | 10-4 (default) |
| Granulite | 1.1 | 130.7 | 1.99 | 0.9 | 5.4 | 47.5 | 0.027 | User defined | default |
| Limestone 1 | 100 | 7 | 0.8 | 0.39 | 5.4 | 53.3 | 0.033 | User defined | default |
| Limestone 2 | 0.79 | 150 | 1.3 | 0.3 | 5 | 63.4 | 0.033 | User defined | default |
| Iron Ore 1 | 4.3 | 44.9 | 1.28 | 0.46 | 3 | 60.4 | 0.051 | User defined | default |
| Iron Ore 2 | 20.1 | 16.8 | 0.84 | 0.4 | 5 | 44.2 | 0.029 | User defined | default |
| Apatite | 19.3 | 1.05 | 1.62 | User defined | User defined | 45.4 | 0.0115 | User defined | default |
| Kalsruhe Quartz | 3.48 | 43.4 | 1.61 | User defined | User defined | 38.8 | 0.0176 | User defined | default |
| Uintah Basin gilsonite | 7.05 | 5.5 | 1.6 | User defined | User defined | User defined | User defined | User defined | User defined |
| Paragominas bauxite | 14.6 | 70.3 | 0.91 | User defined | User defined | User defined | User defined | User defined | User defined |
| Bingham Canyon copper ore | 1.17 | 96.1 | 1.26 | User defined | User defined | 44.8 | 0.0263 | User defined | User defined |
| Cyprus Sierrita copper ore | 1.37 | 170.9 | 1.41 | User defined | User defined | 58.9 | 0.0204 | User defined | User defined |
| IOCC iron ore | 1.08 | 47.3 | 2.3 | User defined | User defined | 65.4 | 0.0932 | User defined | User defined |
| Santa Luzia gneisse | 2.78 | 48.7 | 1.82 | User defined | User defined | 54.8 | 0.0274 | User defined | User defined |
| Vigne´ sienite | 101 | 26.5 | 0.67 | User defined | User defined | 66.2 | 0.0146 | User defined | User defined |
| Utah marble | 0.882 | 45.9 | 1.76 | User defined | User defined | 76.3 | 0.0792 | User defined | User defined |
In the table, the values of φ were found to vary below 1 and about 2.5. The residual particle fracture energy of minerals E∞ is generally found to be consistently lower than that of ores and rocks, which indicates the higher toughness of the latter. Also, the characteristic size do is significantly coarser for minerals than polycrystalline materials, such as ores and rocks, which reflects the finer micro structures of the latter (Tavares 2007).
Where Ef is the fracture energy of the particle, D is the damage, eEk is the specific stressing energy (or effective impact energy) involved in the collision, and γ is the damage accumulation coefficient, which characterizes the amenability of a material to sustain damage prior to catastrophically breaking. Finally, e is the proportion of energy involved in a collision and which is allocated to the particles based on their stiffness defined as:
Where kp is the particle stiffness, ks is the stiffness of the surface in contact with the particle. In case of a collision involving two particles of the same material, equation 7 gives e=0.5, since the energy will be equally shared between them.
| Symbol | Name |
|---|---|
| y | Damage constant |
| Global Damping Strength | Percentage of total contact force upon the particle (%) |
| Global Damping Time | Duration of global damping strength upon the particle (sec) |
| E∞ | E50 parameter (J/kg) |
| d0 | E50 parameter (mm) |
| ϕ | Fitting parameter |
| σE | Standard deviation of the fracture energy |
| A | Impact breakage parameter used in the calculation of the t10 |
| b | Impact breakage parameter used in the calculation of the t10 |
| dmin | Minimum particle size for breakage (mm) |
| Emin | Minimum collision energy (J) |
| Ct | Fraction of shear energy |
| Truncation ratio | Upper limit of fracture energies |
Emin is the minimum impact energy. It is considered such that all impact events that level have negligible effect on the particles, and can be discarded. The default recommended value is 1e-4.
The extent of breakage of the fragments can be represented by the single parameter, t10, which represents the proportion of fragments that are finer than 1/10th of the parent particle size (Napier-Munn et al., 1996, Tavares, 2007). Tavares, 2009 proposed that the extent of breakage when stressing a batch of particles is related to the specific stressing energy and the median fracture energy of the particles as follows:
Where A and b are impact parameters fitted to experimental data, in which A corresponds to the maximum value of t10 that can be achieved when breaking a material in a single impact event. The higher the specific impact energy Ek in comparison to the specific fracture energy of the particles, the higher the value of t10 and the finer the progeny size distribution. By using the median specific fracture energy of the particles that underwent breakage, equation 8 is able to account for the particle size effect in breakage (Tavares 2009).
To accurately simulate breakage of spherical particles in DEM, the definition of the progeny size distribution in which the parent particle will be replaced is required. To address this, Tavares and Chagas (2020) recently provided standard families of progeny fragments that were created based on accumulating breakage data of forty different materials, paired with a process that uses Monte Carlo simulations to draw each of them when a particle breaks. For a range of discrete values of t10, families of progeny size distributions have been proposed. The aforementioned families have been designed so that no more than 1% of the mass is lost or gained each time a parent particle is replaced by its fragments.
To eliminate the mass loss and provide accurate size distributions, while maintaining simulation efficiency, a size class has been created, called dummy particles, which describes fragments down to 1/5th of the parent size. The particles contained in this dummy size class are not allowed to suffer breakage. You can create a new material and name its particle as a 'dummy particle' with lower elasticity for this particular size class. This would be particularly beneficial in the case of confined systems, where such particles would not contribute as readily to the increase of stresses in the system.
EDEM Outputs
- New fracture energy per particle type
- Fragment size distribution
Calibration tests
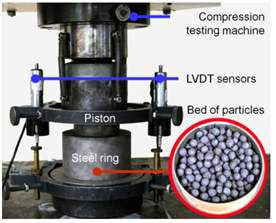
Materials can break either by high impact forces or by low-energy stressing events. The fundamental properties of the fracture process can be studied most effectively by well-controlled experiments on single particles and/or small volumes of material thus suitable calibration tests have been designed over the years.
The traditional approaches to measure the fracture characteristics of particles under repeated impacts include drop weights tests and the Hopkison bar. A more sophisticated method, that is the result of the hybridization of the aforementioned standard approaches, is the Ultra Fast Load Cell (UFLC), where steel balls strikers are dropped from various heights with the aim to produce desired impact energies (King and Bourgeois 1993, Tavares and King 1998, Tavares and King 2002). The advantage of this method over the other methods is the fact that does not contain empirical constants in the calculation of the overall deformation between contacts, and therefore, absolute calibration is possible.