Test Descriptions
The following tests were performed - Untapped Bulk Density Test, Tapped Bulk Density Test, Static Repose Angle Test, and Compressibility Test.
Untapped Bulk Density Test
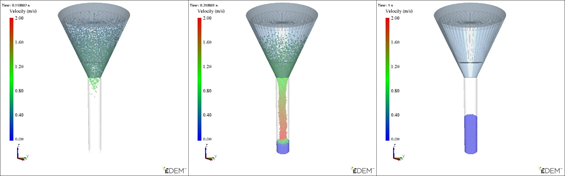
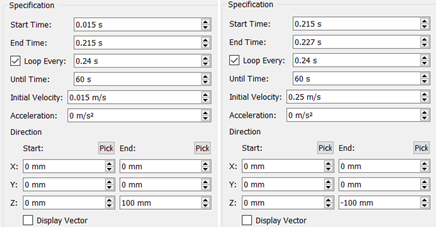
Tapped Bulk Density Test
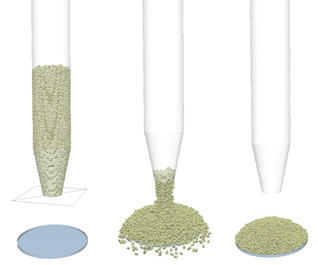
Static Angle of Repose Test
Compressibility Test
0.05 kg of material was filled in a cylinder as per the untapped bulk density test. The sample material was then compressed under a pressure of 3 MPa (using the EDEM Coupling Interface) and the final material height recorded.
The amount of compression is calculated as: ‘Difference in sample height’/‘sample height before compression’, where the difference in sample height is the difference before and after compression.
The Compressibility index and Hausner ratio are calculated as: 100 x (tapped density – untapped density)/tapped density’ and ‘tapped density’/‘untapped density’ respectively.
Estimating Run Times
| Compressibility Ratio | Time step(s) | Cases |
|---|---|---|
| 0.1 | 8.00E-07 | 1, 4, 7 |
| 0.5 | 6.00E-07 | 2, 5, 8 |
| 0.9 | 3.00E-07 | 3, 6, 9 |
However. investigations into the Time Step suggested that the Compression tests and Angle of Repose tests were unaffected by running at higher Time Steps. A value of 2e-6 s was used for the Angle of Repose tests and 5e-6 s for the Tapped Bulk Density tests.
| Time step(s) | Simulation run time (s) | Time per iteration per particle (microseconds) | Number of Particles | Estimated Run Time (days) |
|---|---|---|---|---|
| 2.00E-06 | 1 | 1.2 | 1000000 | 6.9 |
| 2.00E-06 | 1 | 1 | 1000000 | 5.8 |
| 2.00E-06 | 1 | 0.8 | 1000000 | 4.6 |
| 2.00E-06 | 1 | 0.6 | 1000000 | 3.5 |
| 2.00E-06 | 1 | 0.4 | 1000000 | 2.3 |
| 2.00E-06 | 1 | 0.2 | 1000000 | 1.2 |
Number of Iterations = EDEM run time/EDEM Time Step.
Seconds Per Iteration = elapsed real time/number of iterations.
Time Per Iteration per particle = Seconds Per Iteration/Number of particles.
The time per iteration per particle is measured from the relevant hardware setup. First, set up a simulation that takes around 1000 iterations. Then use a stopwatch to measure how long the elapsed real time for the simulation is and use this to calculate time per iteration per particle.
This is typically in the range of 1 microsecond for 8-16 processors. Different values will be found depending on how many spheres are used to make up a particle shape and the type of contact model used.
According to the table, the time per iteration ranges from 1.2 which is high-end CPU’s and 0.2 which would be for a high-end GPU.