
Simplify Curves
Simplify one or more curves by changing the number of control points and inverting their sequence, joining multiple curves, or by applying an arc length parametrization.
-
On the Geometry ribbon, select the Simplify tool.

Note: The tool may be hidden in the dropdown menu. To access the dropdown menu, you can do one of the following:- Select
 at the lower right corner of the
currently displayed tool.
at the lower right corner of the
currently displayed tool. - Click and hold the currently displayed tool.
Tip: To find and open a tool, press Ctrl+F. For more information, see Find and Search for Tools.The guide panel appears. By default, the Curves tab is open.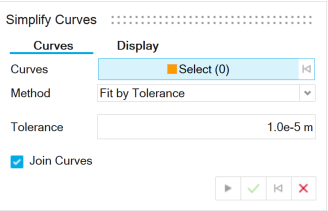
- Select
-
Next to Curves, the Select button is active. Select one
or more curves.
By default, the curve is simplified using the Fit by Tolerance method and, if you selected multiple curves, they are joined.
-
Select a method:
- Fit By Tolerance: By default, the simplified curve fits the Modeling tolerance displayed.
- Fit By Number of Points: Type the number of Control Points. You can also enter the Degree of the curve.
- Reduce Points: Only applies to NURBS curves. Reduce the number of control points in the input curve. You can use Fit By Tolerance to create an approximation of the original curve with fewer points, but you should use the Reduce Points method to collapse control points on the original curve. By default, the simplified curve fits the Modeling tolerance defined in the Preferences. To define a custom tolerance, turn on Custom Tolerance, and then enter the Tolerance. Increase the tolerance to decrease the number of points.
- Arc Length Parametrization: Parametrize the curve by arc length.
-
Select the Edit Control Points checkbox and drag
intermediate points to new locations to change the shape of a curve. End points
are fixed and cannot be modified.
Note: After you edit a curve, a new part is displayed in the Model Browser to show the new curve. The original part is hidden.Tip: To reset the curve, click Reset Control Point Offset. -
In the guide panel, select the Display tab to configure
the display:
Table 1. Option Description Control Points Display the control points. Input Curves Display the input curves in orange. The simplified curve is displayed in blue. Show Max Deviation Display a red point where the distance between the input curves and the simplified curve is the greatest. The Max Deviation indicates the maximum distance between the input curves and the simplified curve.
Input/Output/Reduction (%) The first number corresponds to the number of control points on the original curve, the second number corresponds to the number of control points on the simplified curve, and the last number corresponds to the percentage reduction in the number of points. - Right-click and mouse through the check mark to exit, or double-right-click.