A Scatter graph displays the distribution of two variables that have a strong
correlation to one another.
To select elements for a Scatter graph:
Select the group of elements, type of elements within that group, and the
subset of those elements.
Optionally, select the group of elements, the type of elements within that
group, and the subset of those elements.
The value of one variable is measured on the X-axis and the values of
the other variables on the Y-axis.
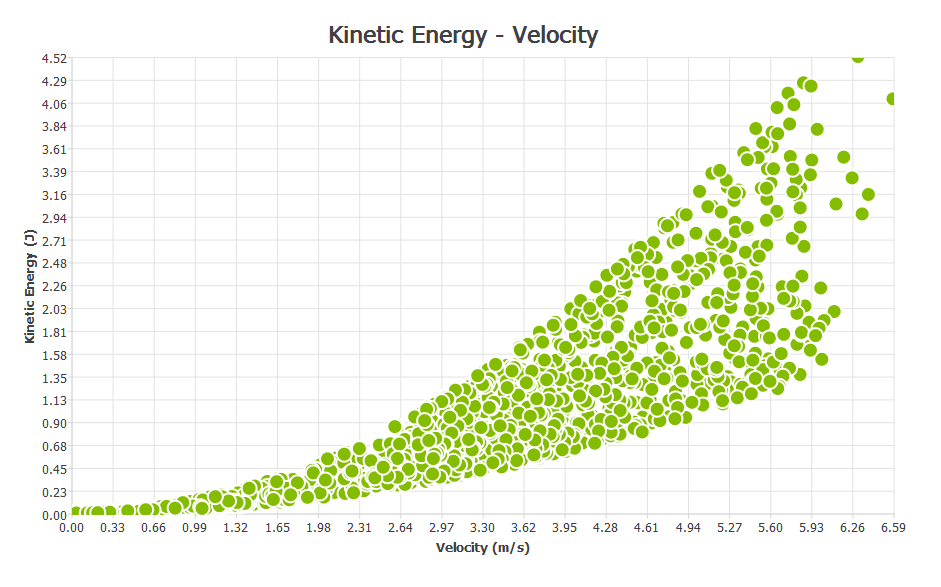
A wide scatter of the plots denotes poor correlation between the two
variables. If the two variables are perfectly correlated, then all the
plots will fall on the diagonal (regression line), such as the velocity
of a set of particles vs kinetic energy.
In this Scatter graph, the kinetic energy is higher with greater particle
velocity, and the distribution of energy is due to the particle size
distribution.
Configure the X-axis
In a Scatter graph, the X-axis measures the value of one variable.
To configure the X-axis:
Click the X-axis tab.
Select the attribute and component to plot on the X-axis.
The attributes available in the list will depend on the elements that have
been previously selected.
The following table shows the attributes and components available for each
element.
Element
Attribute
Components
Contacts
Contact vector 1
Magnitude, X, Y, Z
Contact vector 2
Magnitude, X, Y, Z
Distance
Define reference object*
Normal force
Magnitude, X, Y, Z
Normal overlap
N/A
Position
X, Y, Z
Tangential force
Magnitude, X, Y, Z
Tangential overlap
N/A
Custom property
Depends on the number of elements
Collisions
Average normal force
Magnitude, X, Y, Z
Average tangential force
Magnitude, X, Y, Z
Distance
N/A
Duration
N/A
Maximum normal force
Magnitude, X, Y, Z
Maximum tangential force
Magnitude, X, Y, Z
Normal energy loss
N/A
Position
X, Y, Z
Relative velocity
Magnitude, X, Y, Z
Relative velocity normal
Magnitude, X, Y, Z
Relative velocity tangential
Magnitude, X, Y, Z
Tangential energy loss
N/A
Total energy loss
N/A
Velocity element A
Magnitude, X, Y, Z
Velocity element B
Magnitude, X, Y, Z
Geometry
Compressive force
N/A
Distance
N/A
Position
X, Y, Z
Pressure
N/A
Torque (element)
Magnitude, X, Y, Z
Total Force
Magnitude, X, Y, Z
Velocity
Magnitude, X, Y, Z
Custom property
Depends on number of elements
Particle
Acceleration
Magnitude, X, Y, Z
Angular Velocity
Magnitude, X, Y, Z
Aspect Ratio
Magnitude, X, Y, Z
Compressive Force
N/A
Coordination Number
Standard, Avg., Total, Min. or Max
Diameter
N/A
Distance
Define reference object*
Frozen
N/A
Kinetic Energy
N/A
Length
N/A
Mass
N/A
Mass Scale
N/A
Position
X, Y, Z
Potential Energy
N/A
Residence Time
N/A
Rigid Link
Rotational Kinetic Energy
N/A
Scale
N/A
Shape Scale
Magnitude, X, Y, Z
Torque
Magnitude, X, Y, Z
Total Energy
N/A
Total Force
Magnitude, X, Y, Z
Velocity
Magnitude, X, Y, Z
Volume
N/A
Custom property
Depends on the number of elements
Note:
If the attribute is set to Distance, you must define a point or
plane from which the distance is measured. When you select
Distance, the Define Reference Object
section of the pane will be activated. Select
Point or Plane
and define its position and, for a plane, its distance from the
origin.
The X and Y axes are related. The attribute you select to
measure on the X-axis will limit those attributes available to
measure on the Y-axis. Similarly, if the Y-axis is configured
first, the attributes available on the X-axis will be
limited.
Configuring the Y-Axis
In a Scatter graph, the Y-axis measures time element attributes and components.
To configure the Y-axis:
Click the Y-axis tab.
Select the element attribute and component to be plotted on the
Y-axis.
The attributes available in the list will depend on the elements
previously selected and the attribute being measured on the X-axis. You can
select a component type for certain attributes. This is used to determine
which value will be plotted for a particular attribute component. For
example, the maximum, minimum, or average particle velocity.
The following table shows the range of attributes, components, and
component types available for each element.
Element
Attribute
Components
Particle
Acceleration
Magnitude, X, Y, Z
Angular Velocity
Magnitude, X, Y, Z
Aspect Ratio
Magnitude, X, Y, Z
Compressive Force
N/A
Coordination Number
Standard, Avg., Total, Min. or Max
Diameter
N/A
Distance
Define reference object*
Frozen
N/A
Kinetic Energy
N/A
Length
N/A
Mass
N/A
Mass Scale
N/A
Position
X, Y, Z
Potential Energy
N/A
Residence Time
N/A
Rigid Link
Rotational Kinetic Energy
N/A
Scale
N/A
Shape Scale
Magnitude, X, Y, Z
Torque
Magnitude, X, Y, Z
Total Energy
N/A
Total Force
Magnitude, X, Y, Z
Velocity
Magnitude, X, Y, Z
Volume
N/A
Custom property
Depends on the number of elements
Contacts
Average normal force
Magnitude, X, Y, Z
Collisions
Average tangential force
Magnitude, X, Y, Z
Distance
N/A
Duration
N/A
Maximum normal force
Magnitude, X, Y, Z
Maximum tangential force
Magnitude, X, Y, Z
Normal energy loss
N/A
Position
X, Y, Z
Relative velocity
Magnitude, X, Y, Z
Relative velocity normal
Magnitude, X, Y, Z
Relative velocity tangential
Magnitude, X, Y, Z
Tangential energy loss
N/A
Total energy loss
N/A
Velocity element A**
Magnitude, X, Y, Z
Velocity element B
Magnitude, X, Y, Z
Geometry
Compressive force
N/A
Distance
N/A
Position
X, Y, Z
Pressure
N/A
Torque (element)
Magnitude, X, Y, Z
Total force
Magnitude, X, Y, Z
Velocity
Magnitude, X, Y, Z
Custom property
Depends on number of elements
Bond
Normal force
Magnitude, X, Y, Z
Normal force
Magnitude, X, Y, Z
Tangential force
Magnitude, X, Y, Z
Tangential moment
Magnitude, X, Y, Z
Note:
If the attribute is set to Distance, you must define a
point or plane from which the distance is measured. When
you select Distance, the Define
Reference Object section of the pane will be activated.
Select the point or plane from which the distance should
be measured. A point is defined by its xyz position, and
a plane by its orientation and distance from the
origin.
When the axis is set to measure the number of particles
or number of contacts, you can plot either the total
number of particles/contacts or the total number in a
defined range. For example, counting only those
particles with mass between 0.1kg and 0.2kg or velocity
between 2m/s and 5m/s. When you select Total
in Range, the Secondary Attribute
section of the pane is activated. Select the attribute
and component and enter the maximum and minimum values
of that range to restrict the range.