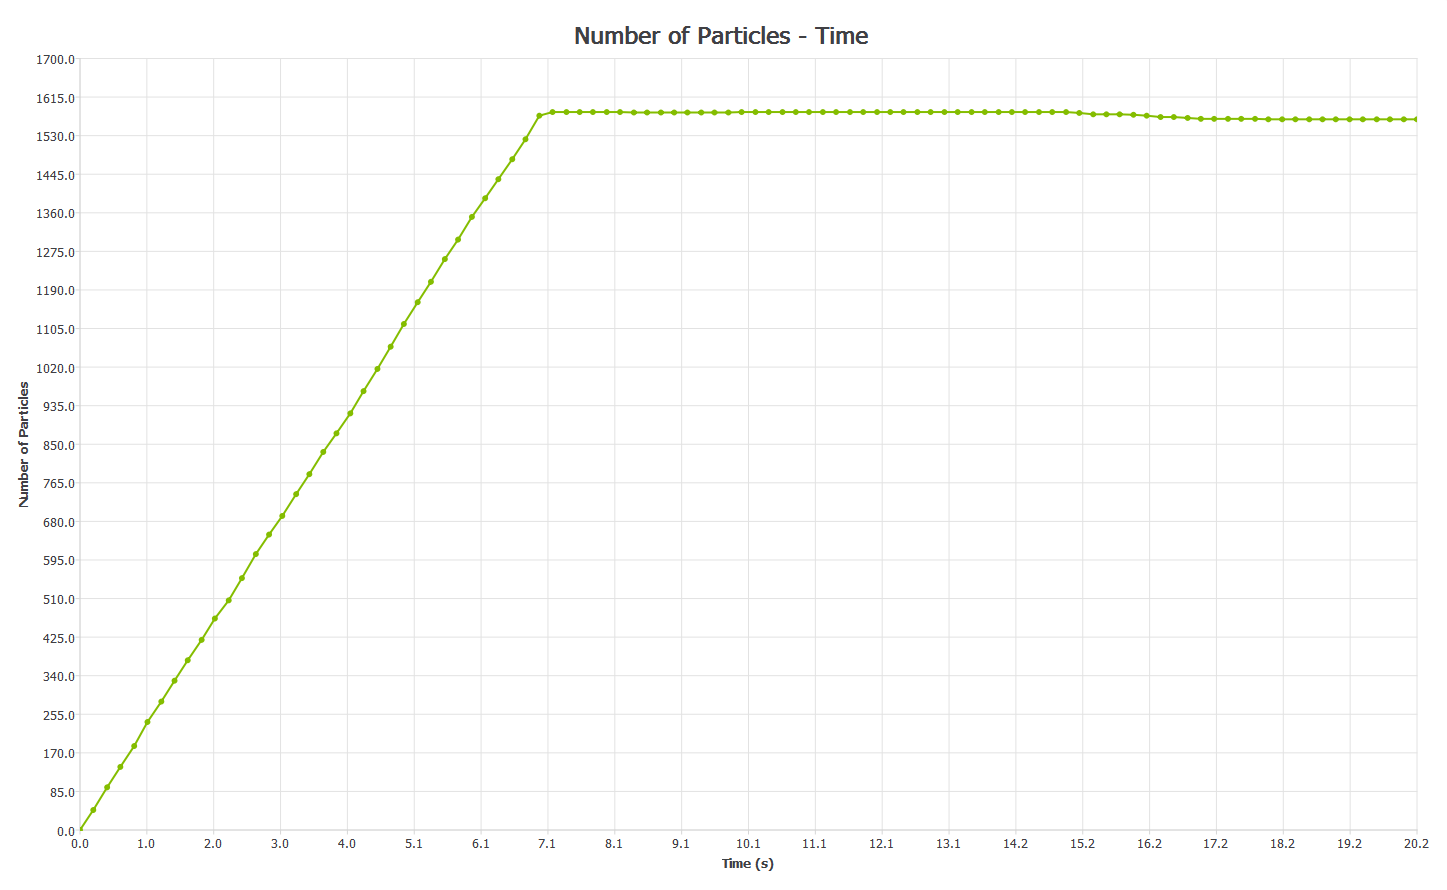
A Line graph helps visualize trends and values over a specific period of time, such
as the number of particles in a simulation. The Select Element section helps determine which
elements in your model to collect data from.
To select elements for a Line graph:
Select the model elements required to collect data from in the Select Element
section.
Optionally, select the group of elements, the type of elements within that
group, and the subset of those elements.
Configure the X-axis
In a Line graph, the X-axis measures time.
To configure the X-axis:
Click the X-axis tab.
Specify the Start and End
values to define the time interval over which your data will be plotted.
(Grayed-out time steps indicate partial saves and may not contain all the
data you want to plot).
Select the Logarithmic Scale checkbox to display
logarithmic time increments along the X-axis.
Set the number of intervals on the axis (a greater number of intervals
increases the accuracy of the chart).
Set the maximum number of points that will be displayed.
Note: Reducing the number of points may improve the
readability of the graph.
Configure the Y-axis
In a Line graph, the Y-axis measures time element attributes and components.
To configure the Y-axis:
Click the Y-axis tab and select the attributes and components to be plotted
on the Y-axis.
The attributes available in the list will depend on the elements
previously selected. You can also select a component type for certain
attributes. This is used to determine which value will be graphed for a
particular attribute component. For example, maximum, minimum, or average
particle velocity.
To define several attributes in a different Y-Axis and visualize them in
the same Line graph, add Y-Axis to the dropdown list, and select and define
each of the attributes.
You can visualize all the attributes in the same scale by enabling
the Display same axis scale for all Y axes
checkboxes. The Histogram (with the exception of collisions and Torque) and
Line graphs have the same element attribute options.
When plotting the number of elements (number of particles, contacts,
or collisions) any interpolated data points (those constructed from
the discrete set of known data points) are rounded off to the
nearest whole number.
Plot Torque
EDEM calculates individual contact forces between particles and geometry elements
(triangles). The force has a position on a triangle, and the triangle has a relative
position to the associated Geometry Section such as a Screw Blade.
To plot torque:
Select Torque > Total > X, Y, or Z.
The Contact Force is converted to Torque for the Geometry section. The
axis for this torque is the selected X, Y or Z axis which passes through the
Geometry Center of Mass.
Set a user-defined axis (recommended), and a vector for the selected
Geometry section.
The torque is exported along this axis for the named Geometry
section.