Modal Participation
![]()
Introduction
The Modal Participation tool allows users to request and visualize the contribution of each vibration mode to the structural response at specific frequencies.
- Pre-processing: specifies the necessary data required to compute modal participation during the solver analysis.
- Post-processing: enables visualization of the computed modal participation results using 2D graphs and bar charts.
Modal Participation
- A natural frequency
- A mode shape (the deformation pattern of the structure)
- A modal mass and stiffness
When the structure is excited by harmonic loads, the total response results from the superposition of the contributions from all modes. However, not all modes contribute equally. Some modes dominate the response within certain frequency ranges, while others have little to no influence.
Modal participation helps identify these dominant modes and quantify their relative impact on the overall response at a given frequency.
Importance of Modal Participation
- Identify the modes that have the greatest influence on displacement, velocity, or acceleration.
- Understand whether modes act in-phase or out-of-phase with the total response.
- Evaluate how modal behavior evolves across the excitation frequency range.
- Support design decisions by focusing on the most significant modes to minimize vibration and noise issues.
Computation Methods Supported in SimLab
- Magnitude and
- Projected
Both methods quantify how each vibration mode contributes to the total response, but they differ in how they treat the phase information.
Magnitude Method
This method measures the overall strength of each modal contribution, regardless of phase. It indicates how strongly each mode participates in the response at a given frequency.
- Evaluates the total amplitude of each modal contribution.
- Ignores the phase relationship between the mode and the total response.
- Easy to interpret and useful for ranking modes by relative importance.
- For quick comparison between modes.
- When the interest is in identifying the most energetic or dominant modes.
Projected Method
By projecting each mode onto the total response the projected method accounts for the phase relationship between each mode and the total response. It captures whether a mode acts in-phase or out-of-phase with the total response, providing a more physically meaningful interpretation.
- Includes both magnitude and phase alignment information.
- Positive values indicate in-phase modes, while negative values indicate out-of-phase modes.
- Gives deeper insight into how individual modes influence the actual system behavior.
- To understand whether individual modes act in-phase or out-of-phase with the total structural response. This helps determine whether a mode amplifies (in-phase) or attenuates (out-of-phase) the overall vibration at specific frequencies.
- When analyzing resonance peaks or response sign changes observed in displacement, velocity, or acceleration results, to understand how modal phase relationships influence the total response.
Modal Participation setup
Accessing the Tool
User can access the Modal Participation tool from Analysis > Requests > Modal Participation.
- A Modal Frequency Response solution with load cases is defined, and one of the Modal Frequency Response load cases is set as Current.
Defining the Modal Participation Setup
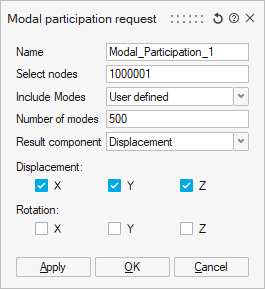
- Name
Enter a name for the Modal Participation request. This name will be used to identify the object in the Solution Browser.
- Select Nodes
Pick the nodes where modal participation will be evaluated.
- Specify Included ModesDefine which modes are considered in the participation calculation:
- All – Participation factors will be computed for all calculated structural modes.
- User defined – Specify a fixed number of modes. The selected modes will correspond to those with the largest magnitude of modal contribution.
- Select Result TypeChoose the physical quantity to evaluate:
- Displacement
- Velocity
- Acceleration
- Select Degrees of Freedom
Specify the degrees of freedom (DOFs) along which modal participation will be computed.
- Confirm the Setup
Click OK to create the Modal Participation request.
A new object is added under the Requests section of the Result branch in the associated load case within the Solution Browser:
Editing a Modal Participation Request
To modify the definition of an existing Modal Participation request, simply double-click the object in the Solution Browser.
The panel will reopen, allowing user to adjust any of the previously defined parameters.
Visualizing the Results
After the analysis is complete, modal participation results can be reviewed directly within SimLab.
To visualize the results double-click on the Modal Participation object.
This opens the Modal Participation panel, which contains three distinct sections:
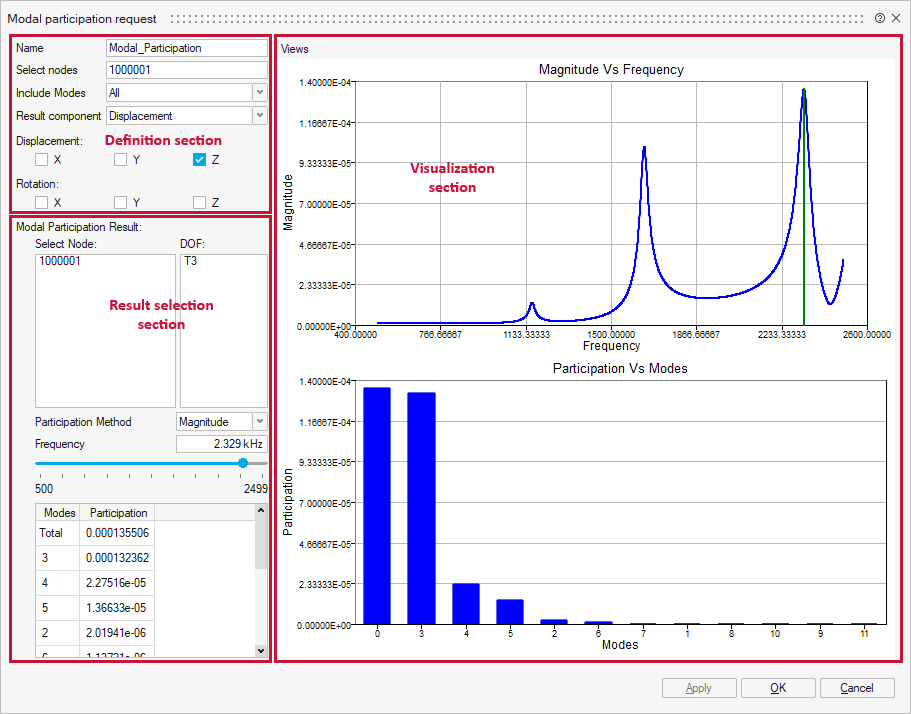
Definition Section
This section displays the original setup of the Modal Participation request.It corresponds to the same panel used during the definition stage and allows user to review or modify the existing definition.
If the definition is modified after the analysis is complete, SimLab will display a warning message when clicking on OK. This message informs the user that the model setup has changed and that existing results will be deleted. In this case a new analysis must then be run to review the new modal participation results.
Result Selection Section
- Node: the node for which participation results are displayed.
- Degree of Freedom: the degree of freedom to evaluate.
- Method: select between Magnitude and Projected participation computation.
- Frequency: the excitation frequency at which to evaluate modal participation.
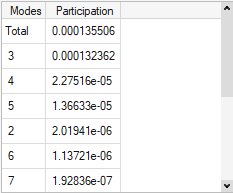
- For the Magnitude method, the table lists the magnitude values of modal
participation for each mode.
Modes are sorted from the highest to the lowest participation magnitude, allowing the user to quickly identify the dominant modes.
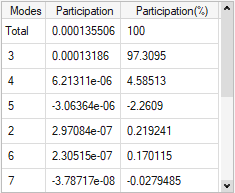
- For the Projected method, it lists the projected values and the percentage
contribution of each mode to the total response.
Modes are sorted by the absolute value of their projected value onto the total response, from highest to lowest.
Visualization Section
- The upper plot shows the response curve (displacement, velocity, or acceleration) for the selected node and degree of freedom.
- The lower plot displays a bar chart representing the modal participation
for the 10 most contributing modes. The horizontal axis corresponds
to the mode number, while the vertical axis represents:
- The participation magnitude for the Magnitude method.
- The percentage contribution for the Projected method.
- The bar with abscissa 0 represents the total response, and the other bars represent the contribution of each individual mode.
- The modes in the bar chart are sorted using the same logic as in the Result Summary Table.
Analyze Modal Participation results
- Select the node and degree of freedom of interest.
- Choose the computation method (Magnitude or Projected).
- Specify the frequency to evaluate:
- users can either type the frequency value manually, or use the sliding bar located below the input field.
- Moving the sliding bar updates the frequency interactively and move the vertical line on the response curve to indicate the selected frequency.
- This vertical line moves dynamically as user adjust the sliding bar.
- By default, when the Modal Participation tool is opened for the first time, the vertical line is automatically positioned at the peak of the response curve, corresponding to the maximum response amplitude.
- Review the response curve and bar chart to identify dominant modes and their contributions.
OptiStruct Cards Exported
| Solver | Supported cards |
|---|---|
| OptiStruct – Modal Frequency Response subcases | PFMODE (STRUCTURE, ALL, DISP) = SETID |