Working with Add Data Table Wizard
The number of steps in the Add Data Table Wizard will be based on whether you selected a data table from the Data Library or a connector to configure.
Selecting a Data Table in the Add Data Table Wizard
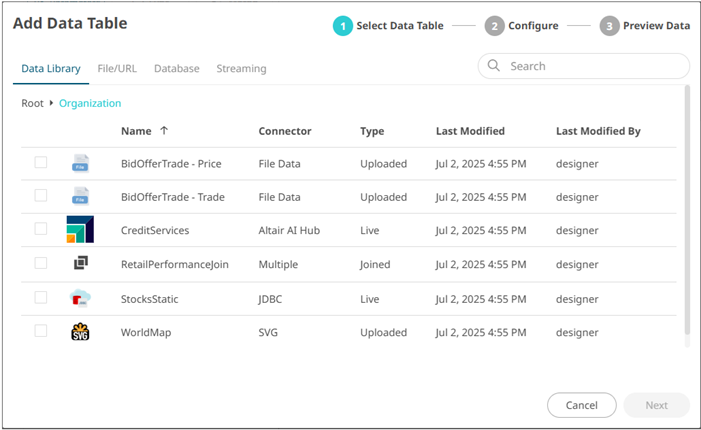
If there are available data tables that were selected in the Data Library page, the Data Library tab will be selected. This option has two steps:
- Add Data Table.
Select the checkbox of one or more data tables you want to include in the workbook.
- Preview Data.
Displays the preview of the data table you selected.
Do one of the following:
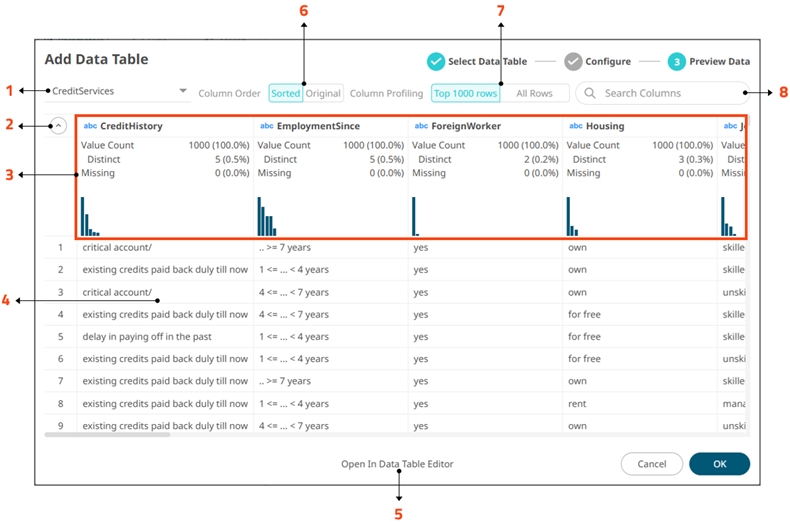
Property Description 1 List of Selected Data Tables
Select one in the drop-down list to display the Data Preview.
2 Collapse Data Profile Pane
Collapse the Data Profile pane. Click
 to expand the Data Profile pane.
3 Data Profile Pane
Displays the following information:
- Rows of Data Profile (i.e., Value Count, Distinct, Missing)
- Data Profile Histogram
4 Data Preview
Execute the queries to return and display data.
NOTE: The maximum number of rows displayed in the Data Preview is 1000.
5 Open in Data Library Editor
Displays the Data Table Editor layout where you can further configure the data table.
6 Group and Sort Columns
Allow you to group and sort columns.
7 Column Profiling
Perform column profiling either for the Top 1000 Rows or All Rows.
8 Search Columns
Allows searching of columns in the Data Preview.
Click
 to save the changes and close the wizard.
Your data will be displayed in the columns of the Data Table pane.
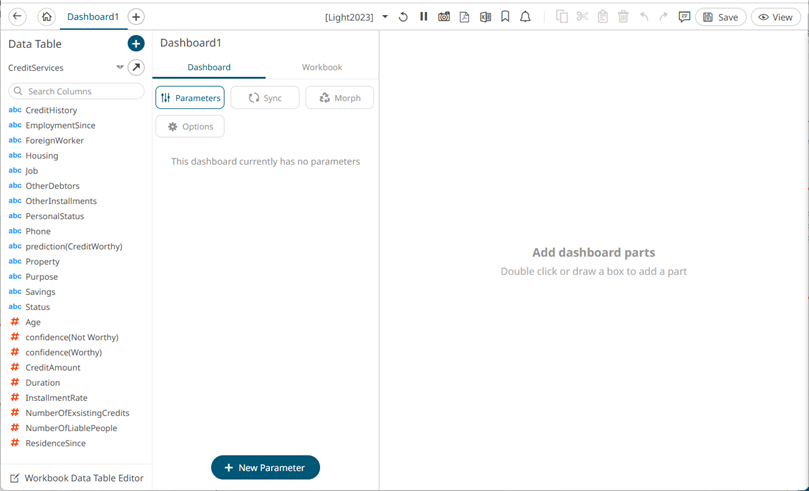
Data tables added from the Data Library using the Add Data Table wizard can be refreshed and deleted from the Data Table pane.
Click the drop-down list and hover on a data table.
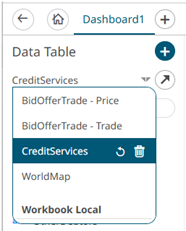
You can do one of the following:
- Click
 to reload the linked data table to reflect the updates done in the Data Library.
 - Click
 to remove the data table from workbook.
Selecting a Connector in the Add Data Table Wizard
This option consists of three steps:
- Select Connector.
Click any of these data source group tabs.
- File/URL
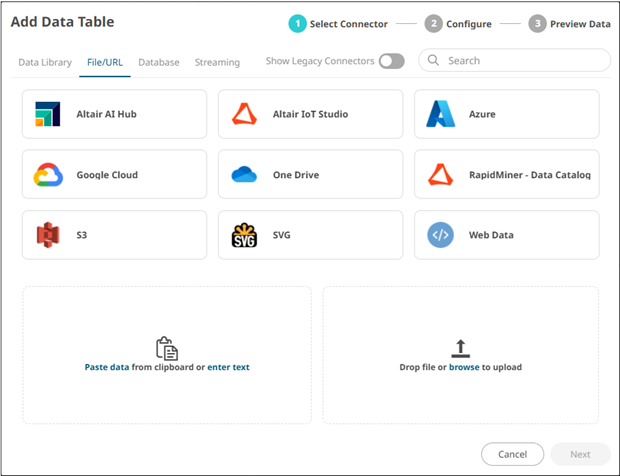
Then one of the following connectors:
Tap the Show Legacy Connectors slider to turn it on and display the following legacy connectors you can select:
- Database
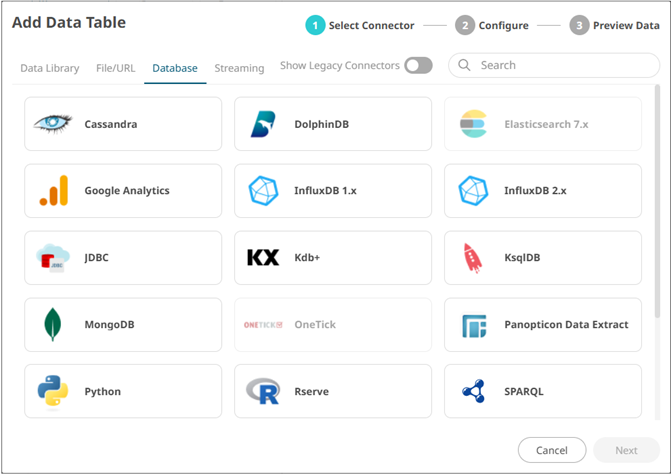
Then one of the following connectors:
Tap the Show Legacy Connectors slider to turn it on and display the following legacy connector you can select:
- Streaming
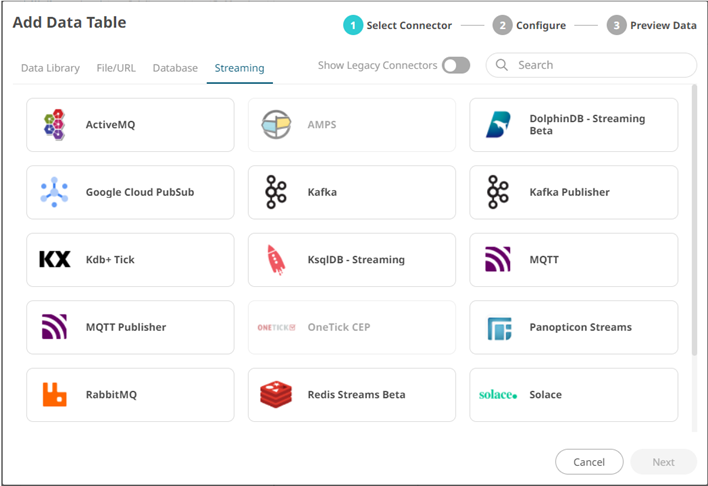
Then one of the following connectors:
- File/URL
- Configure.
Define the settings of the selected connector (e.g., SVG).
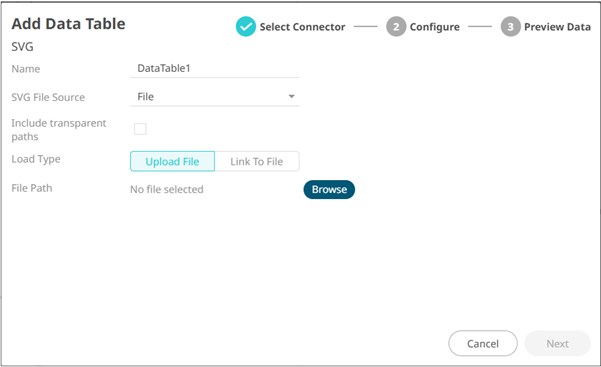
When the necessary properties have been defined, the Next button is enabled.
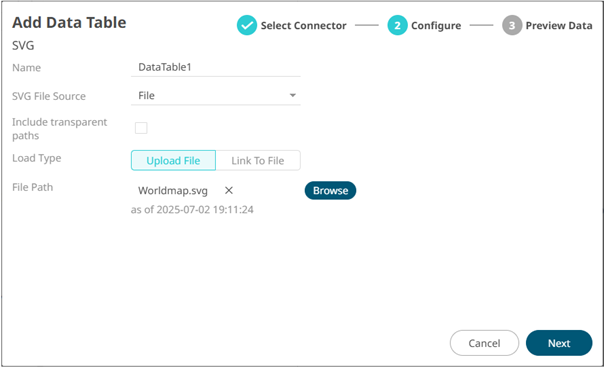
Click
 to move to the next step.
 - Preview Data.
Display the preview of the data table you are creating.
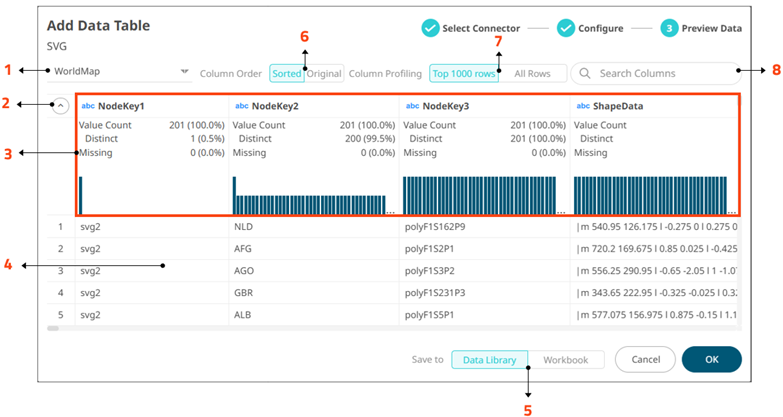
Do one of the following:
Property Description 1 List of Selected Data Tables
Select one in the drop-down list to display the Data Preview.
2 Collapse Data Profile Pane
Collapse the Data Profile pane. Click
to expand the Data Profile pane.3 Data Profile Pane
Displays the following information:
- Rows of Data Profile (i.e., Value Count, Distinct, Missing)
- Data Profile Histogram
4 Data Preview
Execute the queries to return and display data.
NOTE: The maximum number of rows displayed in the Data Preview is 1000.
5 Save to Data Library or Workbook
- Allows you to save the data table in the data library or in the workbook.
- Selecting Workbook displays Open in Data Table Editor.

Clicking Open in Data Table Editor displays the Workbook Internal Data Table Editor layout where you can further configure the data table.
6 Group and Sort Columns
Allows grouping and sorting columns.
7 Column Profiling
Perform column profiling either for the Top 1000 Rows or All Rows.
8 Search Columns
Allows you to search for columns in the Data Preview.
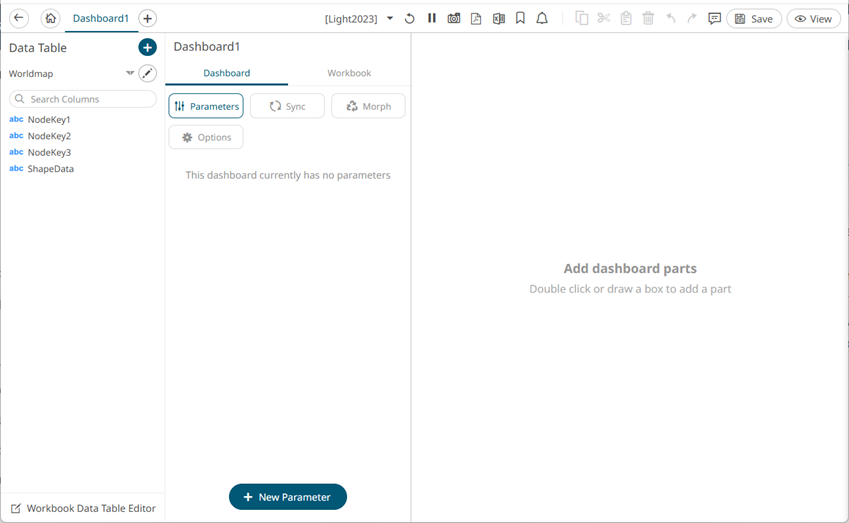
Click
to save the changes and close the wizard.Your data will be displayed in the columns of the Data Table pane. For this example, the data table is saved in the workbook.
(c) 2013-2025 Altair Engineering Inc. All Rights Reserved.