Working with Workbook Internal Data Table Editor Layout
This data table editor accessed in a workbook allows you to quickly connect to any data source and combine data from multiple sources so you can visualize all your data in a single visualization.
Connecting to data environments is easy with pre-built connectors to a wide variety of sources right out of the box.
However, to get the most of these data and produce effective visualizations, they may need to be:
- Integrated with other data sources or files to produce a data with more sense.
- Transformed for normalization and aggregation.
The Workbook Internal Data Table Editor layout is displayed as below, where in this example, there are joined data sources:
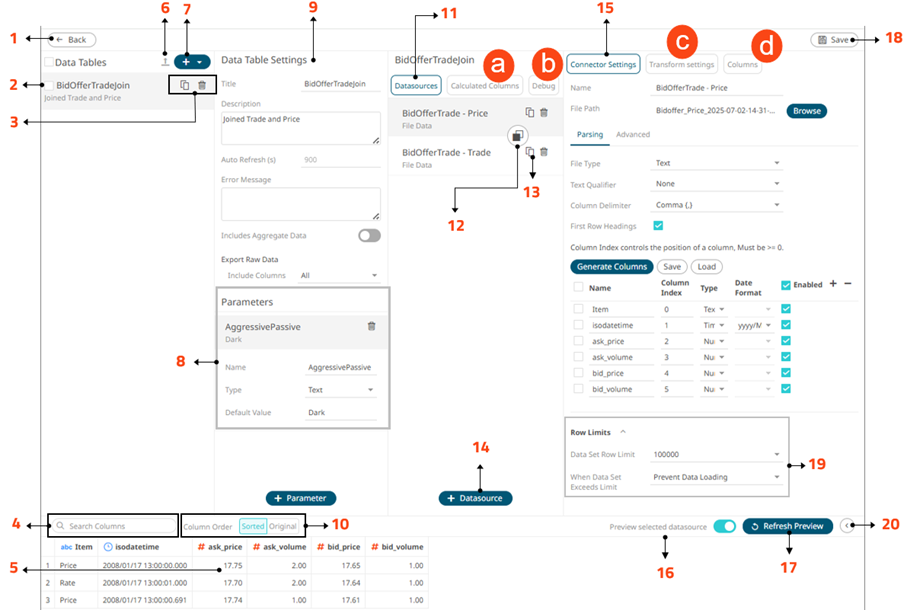
Workbook Internal Data Table Editor Sections and Definitions
| Section | Description |
| 1 |
Back Exit the Workbook Data Table Editor view and go to the Open Workbook in Design Mode |
| 2 |
Data Table List of data tables. Can be rearranged. |
| 3 |
Toolbar After the data is successfully retrieved, these options on the Workbook Data Table |
| 4 |
Search Columns Allows searching of columns on the Data Sources Preview. |
| 5 |
Data Preview Execute the queries to return and display preview of the data table you are creating. NOTE: the maximum number of rows displayed in the Data Preview is 1000. |
| 6 |
Move to Data Library Move the data table to the Data Library. |
| 7 |
Add Data Table or Select Data Template Add data table or select a data table template. |
| 8 |
Data Table Parameters Add or manage data table parameters. |
| 9 |
Data Table Settings Definition of the name of the selected data table, description, and the auto refresh period (in seconds). NOTE: Auto Refresh is disabled for data table in data store and connectors that only work on uploaded data or Upload File load type. These include the following connectors:
Also allows the following:
|
| 10 |
Group and Sort Columns When the Column Order is set to Sorted, the columns are grouped by type (Text, Date/Time, |
| 11 |
Data Sources One or more data sources that can be connected directly with data retrieved on the fly as it is required. Can be rearranged. |
| 12 |
Join/Union All Definition Allows definition of a join or union all of multiple data sources. |
| 13 |
Duplicate Data Source Allows you to create a duplicate data source |
| 14 |
Add Data Source Allows you to add data sources from the available data connectors. |
| 15 |
Connector Settings Displays the connector settings of the data source and allows for limiting the amount of data to be returned. |
| 16 |
Preview Selected Data Source Preview the selected data source on the Data Preview panel. |
| 17 |
Refresh Preview Refresh the data sources preview. |
| 18 |
Save Data Table Save the data table definition and go to the Open Workbook in Design Mode view. |
| 19 |
Row Limits Settings Allows setting of the row limit of data sources. |
| 20 |
Collapse Data Preview Collapse the Data Preview pane. Click |
 to expand the Data Preview pane.
NOTE: Most of these sections are also available in the Data Table Editor in the Data Library page.
Clicking Calculated Columns  displays the New Column list box.
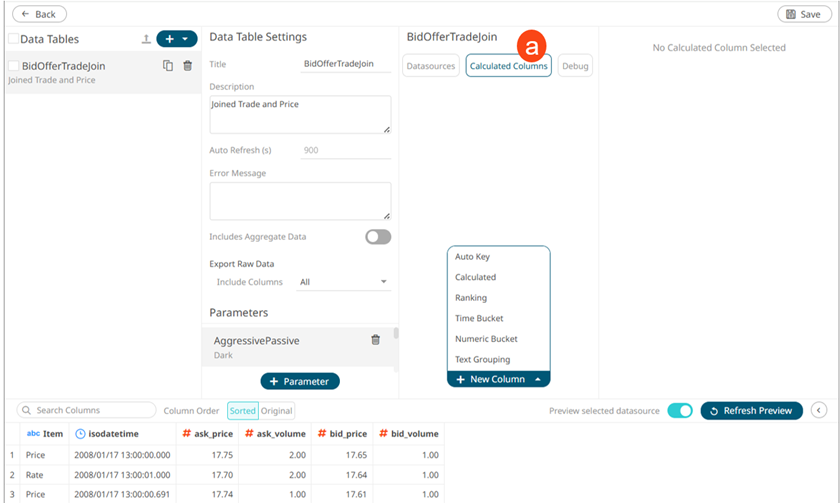
| Option | Description |
|
Add Auto Key |
Allows creation of an auto key for the data schema on the Data Sources Preview. |
|
Add New Calculated Column |
Allows creation of a calculated column from the existing columns in the data table. |
|
Add New Ranking Column |
Allows creation of a new numeric column based on the ranking of columns in your data. |
|
Add New Time Bucket Column |
Allows creation of time buckets (categorical time analysis). |
|
Add New Numeric Bucket Column |
Allows creation of Identity, Sign, Manual, Equal Density, and Equal Distance columns. |
|
Add New Text Grouping |
Allows creation of a grouping based on source text column. |
Clicking Debug  displays the Debug pane.
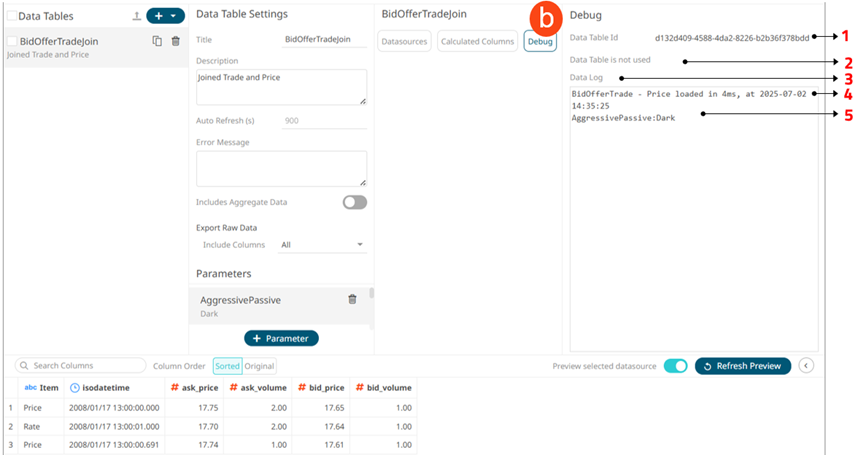
| Section | Description |
| 1 |
Data Table Id Id of the data table. Can be used for parsing of server logs. |
| 2 |
Data table is used on dashboard(s) List of dashboards where the data table is used. If a data table is not used, it |
| 3 |
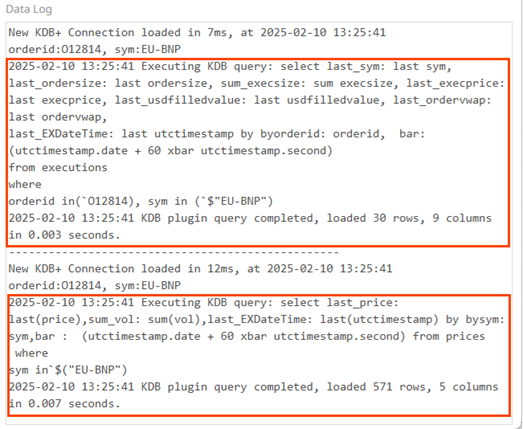
Data Log Logs of the last query IMPORTANT: Data log is supported in Kx kdb+, JDBC, SPARQL, Python connectors, and Python transform.
|
| 4 |
Data Log Details Details of the data log which includes the data source name, response time, and duration (ms). |
| 5 |
Parameters Parameters on the data table. |
Clicking Transform Settings  displays the Transform Settings pane.
![]()
| Section | Description |
|
Transform Settings |
Allows you to perform the following:
|
Clicking Columns  displays the Columns Settings pane.
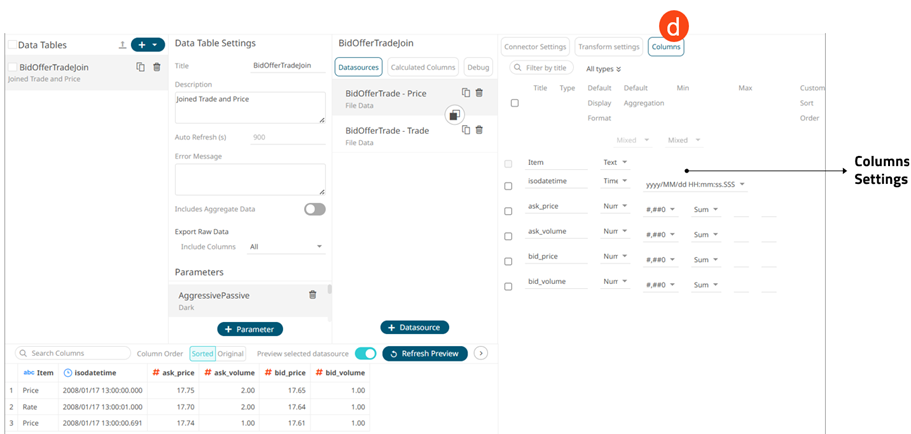
| Section | Description |
|
Column Settings |
Allows you to perform the following:
|
(c) 2013-2025 Altair Engineering Inc. All Rights Reserved.