Field Prediction for Real Time Results Evaluation
Tutorial Level: Intermediate In this tutorial, you will learn how to use some of the Artificial Intelligence tools exposed in Design Explorer by creating a design of experiments (DOE) and training an ML model using the Design Explorer workflow.
Before you begin, copy the file(s) used in this tutorial to your working directory:
Open the Model
- Start HyperMesh.
- From the menu bar, click .
-
Browse to your working directory, select SingleRib.hm, and
click Open.
If prompted, click Change to change the solver interface to OptiStruct while opening the model.A finite element model appears in the modeling window.

Create an Exploration
-
From the Design Explorer ribbon, Exploration tool group, click the
Create Explorations tool.
Figure 2. 
The Explorations dialog opens. -
Click
 then select DOE.
-
In the Study Path field, browse to and select the folder to store your deign of
experiments.
Figure 3. 
-
From the Exploration tool group, click the Design
Explorer tool.
Figure 4. 
The Design Explorer browser opens. You can see the newly created DOE exploration. Additional exploration entities will appear here as well.
Create the Exploration Inputs
-
From the Design Explorer ribbon, click the Gauge
tool.
Figure 5. 
- In the modeling window, select all properties in the model.
-
In the microdialog, click
Create.
Six gauge design variables are created.
Figure 6. 
Create the Exploration Responses
-
From the Design Explorer ribbon, click the Mass/Volume
tool.
Figure 7. 
-
On the guide bar, click
 .
A mass response is created.
.
A mass response is created. -
Click the Stress/Strain tool.
Figure 8. 
-
On the guide bar, click
 to open the Advanced Selection dialog.
-
Select Rib_Web, Rib_Rib1,
Rib_Rib2, Rib_Rib3, and
Rib_Rib4 (all properties besides Rib_Flange) then
click OK.
A stress response is created.
-
On the guide bar, click .
- Change the selection from Stress to Strain using the first drop-down menu.
-
Repeat steps 4-5 above to select the same properties as the stress response
then click OK.
A strain response is created.
-
On the guide bar, click
 .
The DOE now consists of two design variables and three response variables.
.
The DOE now consists of two design variables and three response variables.Figure 9. 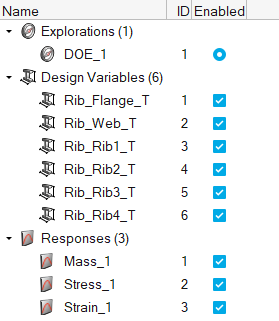
Evaluate the Exploration
-
From the Design Exploration ribbon, Evaluate tool group, click the
Evaluate tool.
Figure 10. 
The Evaluate dialog opens. - Select Field Prediction from the Generate Reports drop-down.
- Optional: Increase the number of concurrent runs by increasing the Multi Execution number.
-
Click Run.
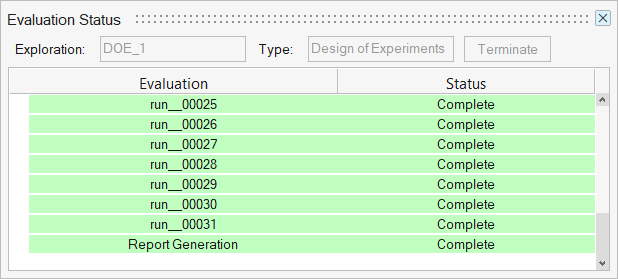
The DOE is evaluated. In this case, there will be a nominal run plus four DOE runs. This may take a few minutes depending on your computer.
Review the Evaluation
-
From the Design Exploration ribbon, Evaluate tool group, click the
Results Explorer tool.
Figure 12. 
The Results Explorer opens. -
Review the Summary table, which shows the input and response values for each
run of the DOE.
Figure 13. 
-
Click the
 Trade Off.
The Trade Off panel opens.
Trade Off.
The Trade Off panel opens. -
In the Field Prediction tab, select Displacement and
click Predict.
An animation client window opens with predicted displacement results contoured.
Figure 14. 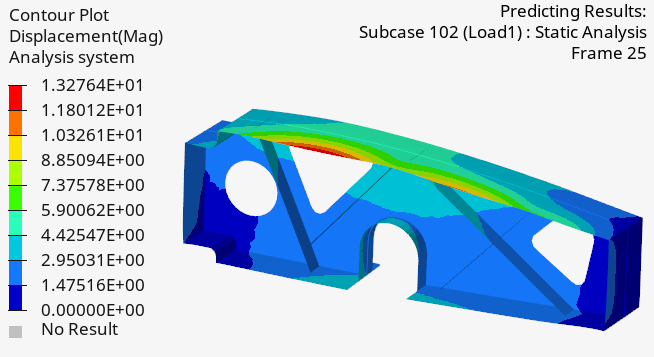
-
In the Inputs area, move the design variables sliders (or key in values in the
Value column).
The predicted results contour is updated accordingly, displaying predicted results in real time.
-
In the Field Prediction tab, right-click on Element Stresses (2D
& 3D) and select Train.
The Element Stress results are trained.
-
In the Field Prediction tab, select Element Stresses (2D &
3D) and click Predict.
The animation client displaying the predicted results is contoured with predicted stress results.
Figure 15. 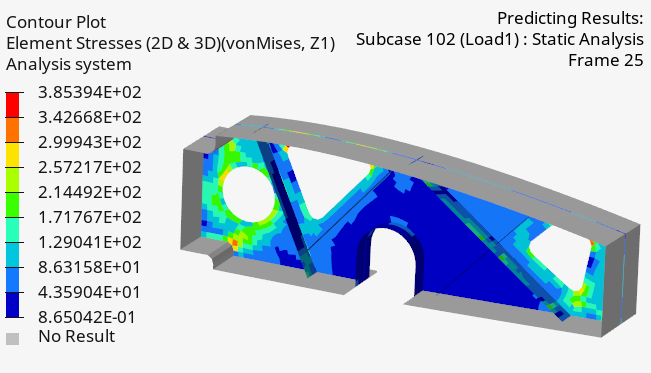
-
In the Inputs area, move the design variables sliders (or key in values in the
Value column).
The predicted results contour is updated accordingly, displaying predicted results in real time.